Training and development activities are essential for upskilling employees, improving performance, and supporting organizational growth. However, without proper budget tracking, training programs can easily exceed allocated funds or suffer from poor resource planning.
The Training Budget Dashboard in Google Sheets offers a powerful, ready-to-use solution for monitoring training expenditures, tracking variances, and analyzing key insights across departments, programs, and trainers. This dashboard helps organizations visualize budget usage, identify overspending, and analyze training duration trends — all in one place.
In this article, we explain every feature of this dashboard in detail, including cards, charts, search features, best practices, and FAQs.
What Is a Training Budget Dashboard in Google Sheets?
A Training Budget Dashboard is a Google Sheets-based analytical tool that helps training teams, HR managers, and L&D specialists track training budgets across different categories. It simplifies the financial monitoring of training programs by displaying real-time insights on:
- Training counts
- Budget allocation
- Budget utilization
- Budget variance
- Overspending
- Department and program-level analysis
- Trainer-specific metrics
Since it works on Google Sheets, the dashboard requires no coding, supports real-time collaboration, and can be easily customized for any organization.
Overview Sheet Tab
Click to Buy Training Budget Dashboard in Google Sheets
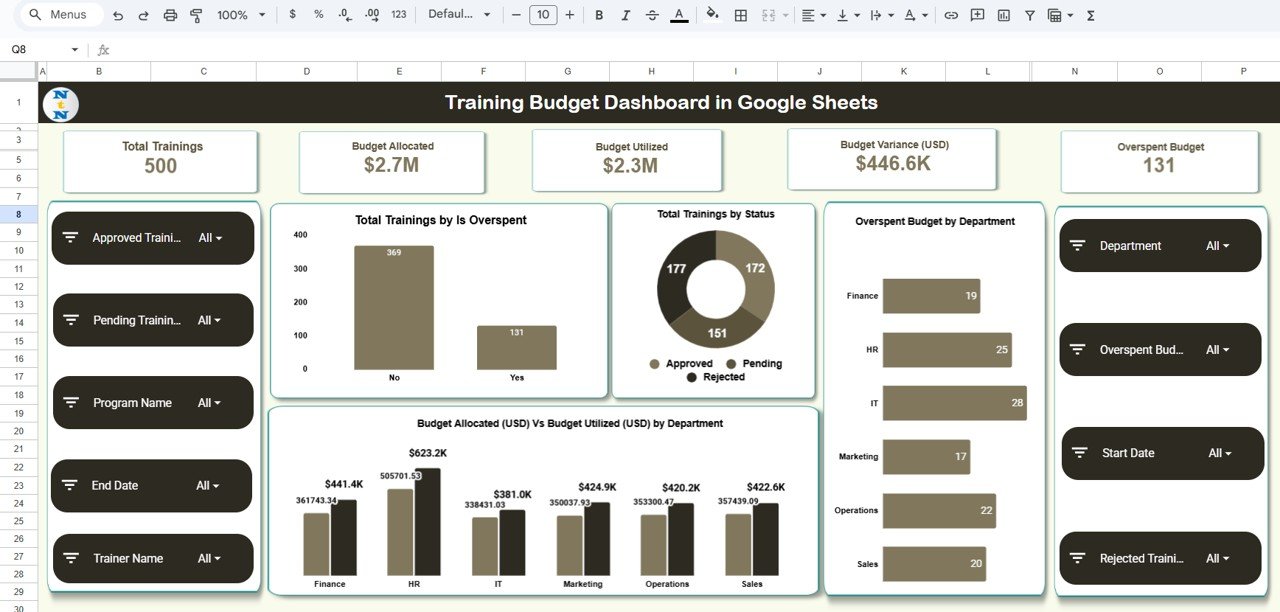
The Overview sheet provides high-level metrics and summary cards.
Dashboard Cards Include:
-
Total Trainings – Number of all training programs conducted/planned
-
Budget Allocated – Total planned budget
-
Budget Utilized – Amount already spent
-
Budget Variance (USD) – Difference between planned vs. actual spending
-
Overspent Budget – Total overspend highlighted across departments/programs
These KPIs provide instant visibility into training financials and control.
Main Dashboard Charts
Total Trainings by Is Overspent
Shows how many training events exceeded the allocated budget.
Total Trainings by Status
Displays trainings by categories such as Completed, In Progress, Planned, Cancelled, etc.
Overspent Budget by Department
Identifies which departments exceeded training budgets and need attention.
Budget Allocated vs Budget Utilized by Department
A dual-bar visual that compares planned vs actual spending — helping detect financial inefficiencies.
Click to Buy Training Budget Dashboard in Google Sheets
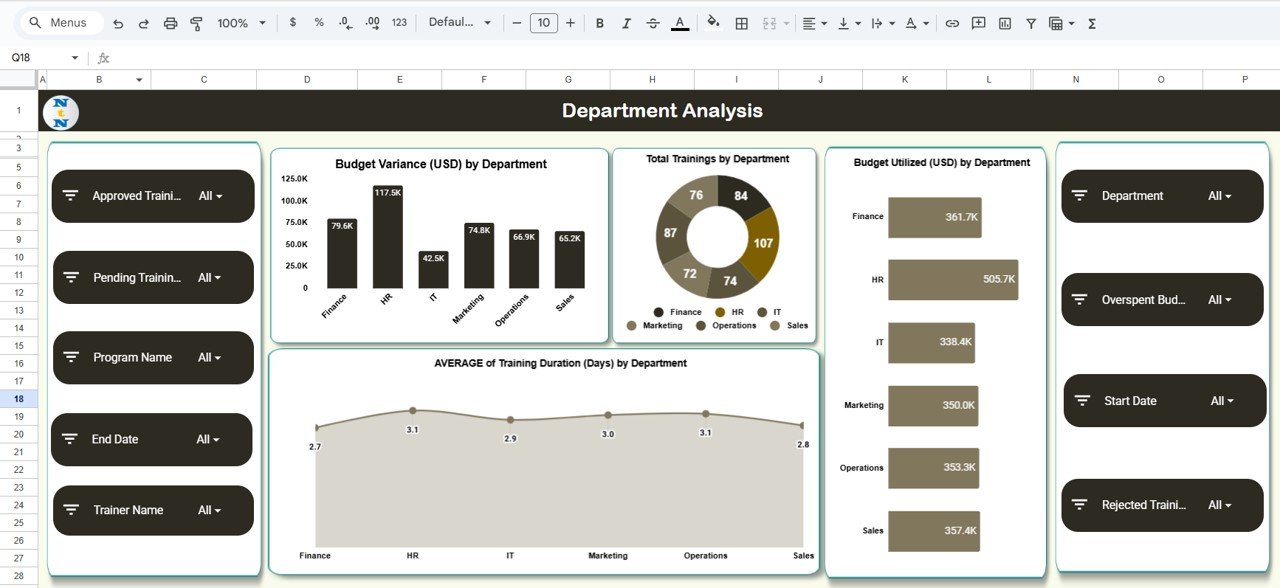
Department Analysis
This section provides deeper insights into department-wise training management.
Charts Included:
-
Budget Variance (USD) by Department
-
Total Trainings by Department
-
Average Training Duration (Days) by Department
-
Budget Utilized (USD) by Department
This helps identify high-investment departments and monitor duration trends.
Click to Buy Training Budget Dashboard in Google Sheets
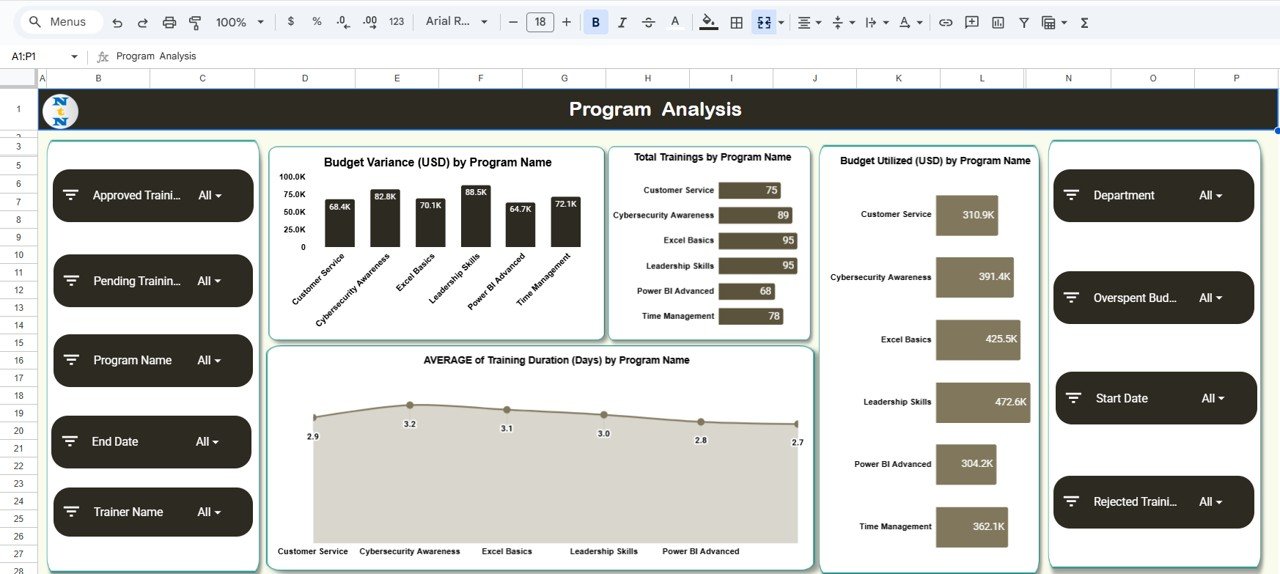
Program Analysis
Evaluate training programs based on their financial utilization and performance.
Charts in This Section:
-
Budget Variance (USD) by Program Name
-
Total Trainings by Program Name
-
Budget Utilized (USD) by Program Name
-
Average Training Duration (Days) by Program Name
This helps training teams understand which programs are efficient, costly, or require redesign.
Trainer Analysis
This section focuses on trainer performance and spending.
Charts Included:
-
Budget Variance (USD) by Trainer Name
-
Budget Utilized (USD) by Trainer Name
-
Average Training Duration (Days) by Trainer Name
This helps identify trainers who consistently exceed budgets or deliver lengthy sessions.

Click to Buy Training Budget Dashboard in Google Sheets
Search Sheet Tab
The Search tab offers quick access to any training record.

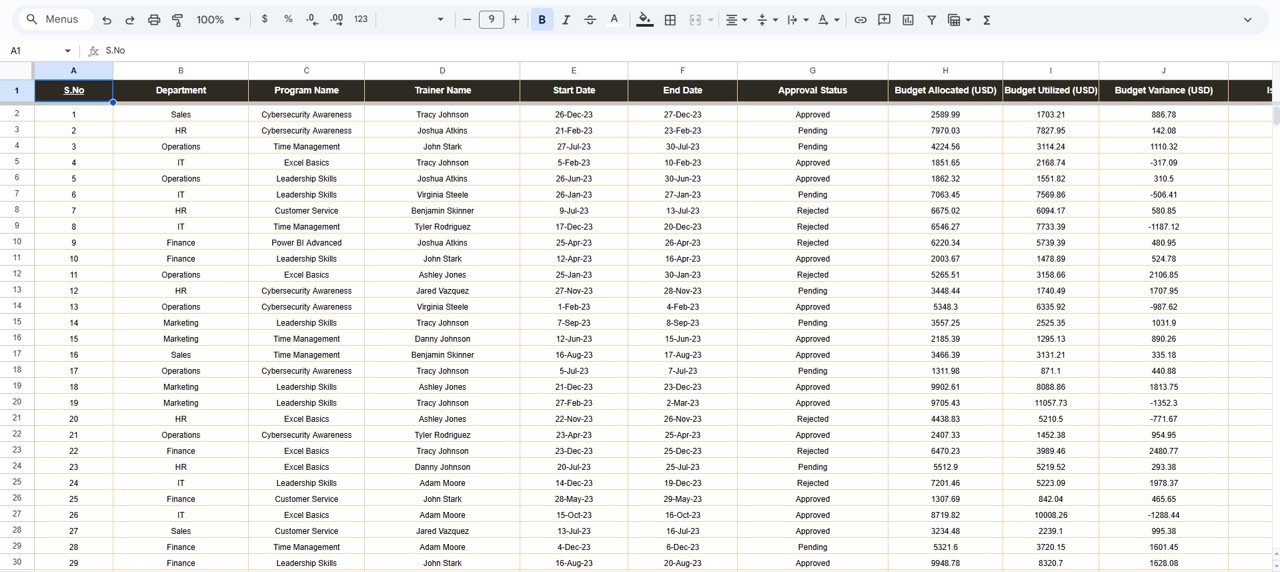
Data Sheet Tab
The Data sheet stores all training records used for calculations and charts.
Typical Fields:
- Training Name
- Program Name
- Department
- Trainer Name
- Duration (Days)
- Budget Allocated
- Budget Utilized
- Variance
- Status
- Is Overspent (Yes/No)
- Training Date
- Notes
Updating the Data sheet instantly updates the charts and dashboard KPIs.
Click to Buy Training Budget Dashboard in Google Sheets
Advantages of the Training Budget Dashboard
-
Clear visibility of overall training spending
-
Helps detect overspent programs
-
Program, trainer, and department-level insights
-
Supports budget forecasting and planning
-
Can be used for training audits
-
100% customizable Google Sheets solution
-
Real-time dashboard updates
Opportunities for Improvement
Enhance the dashboard with these additions:
-
Automatic email alerts for overspending
-
Google Forms integration for training requests
-
ROI tracking (cost vs performance outcome)
-
Trend analysis for year-over-year comparison
-
Trainer rating and feedback score integration
-
Multi-year budget comparison
Best Practices for Training Budget Management
Click to Buy Training Budget Dashboard in Google Sheets
-
Update the data sheet after every training
-
Set realistic budget limits
-
Track variance monthly
-
Review departments with high overspend
-
Maintain accurate training duration logs
-
Compare utilization against allocated budgets regularly
-
Use insights for vendor negotiation
Conclusion
The Training Budget Dashboard in Google Sheets is a complete financial monitoring solution for training teams and HR departments. With its visual KPIs, budget analyses, department insights, and trainer-level comparisons, it ensures full transparency in training investments and helps organizations make better planning decisions.
Whether you manage 10 trainings or 1,000 trainings annually, this dashboard helps you stay in control of costs, identify overspending, and optimize resource allocation.
Frequently Asked Questions (FAQ)
Click to Buy Training Budget Dashboard in Google Sheets
1. Can I add more training categories?
Yes, the dashboard is fully customizable.
2. Does it support multi-year tracking?
Yes — duplicate sheets or extend your Data sheet.
3. Can it track overspending automatically?
Yes, based on variance formulas.
4. Can I add trainer rating or feedback?
Yes — add more columns in the Data sheet.
5. Do charts update automatically?
Yes, all visuals refresh when data changes.
Visit our YouTube channel to learn step-by-step video tutorials
Youtube.com/@NeotechNavigators