Managing the transportation and logistics of goods effectively is crucial for businesses that rely on timely deliveries and cost management. The Transportation & Logistics Dashboard in Google Sheets is a ready-to-use tool designed to help you track and analyze key logistics and shipping metrics. With real-time data tracking and visual reporting, this dashboard helps logistics managers stay organized, optimize shipping processes, and reduce costs.Transportation & Logistics Dashboard In Google Sheets
In this article, we will explore the features of the Transportation & Logistics Dashboard and explain how it can benefit your business operations.
What is the Transportation & Logistics Dashboard in Google Sheets?
The Transportation & Logistics Dashboard in Google Sheets is a dynamic tool that tracks various key performance indicators (KPIs) related to shipments, shipping costs, distances, transit times, and more. This dashboard helps logistics and transportation teams monitor their performance in real-time, visualize trends, and make data-driven decisions to improve efficiency and reduce costs.
The dashboard consists of two key worksheets: the Dashboard Sheet Tab and the Data Sheet Tab. These sheets work together to provide a comprehensive view of logistics operations.
Key Features of the Transportation & Logistics Dashboard
Click to buy Transportation & Logistics Dashboard In Google Sheets
1) Dashboard Sheet Tab: The Main Reporting Interface
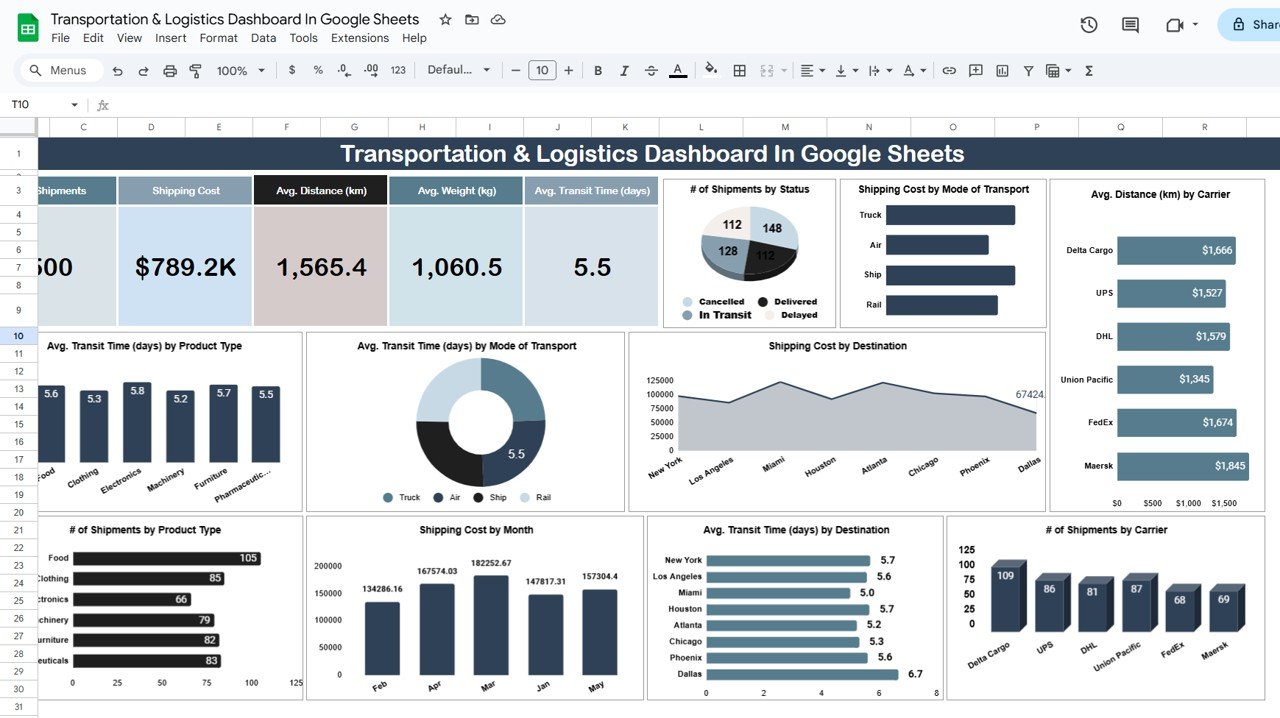
The Dashboard Sheet Tab serves as the central hub of the Transportation & Logistics Dashboard, offering a visual overview of key metrics and performance indicators. The dashboard includes the following elements:
Cards:
- # of Shipments: Displays the total number of shipments processed.
- Shipping Cost: Shows the total cost of shipping for the selected data range.
- Avg. Distance (km): Displays the average distance traveled by shipments (in kilometers).
- Avg. Weight (kg): Shows the average weight of items shipped (in kilograms).
- Avg. Transit Time (days): Displays the average transit time for shipments (in days).
These cards provide a quick summary of the most important shipping metrics, helping you stay on top of your logistics performance.
Charts:
- # of Shipments by Status: A chart that breaks down the number of shipments by their status (e.g., completed, pending, in transit).
- Shipping Cost by Mode of Transport: Displays the shipping cost distribution based on different modes of transport (e.g., road, air, sea).
- Avg. Distance (km) by Carrier: Shows the average distance covered by different carriers.
- Shipping Cost by Destination: A chart that breaks down shipping costs by destination region or country.
- Avg. Transit Time (days) by Mode of Transport: Displays average transit time based on the transport mode.
- Avg. Transit Time (days) by Product Type: Shows how transit time varies by product type (e.g., perishable goods, electronics, clothing).
- # of Shipments by Product Type: Tracks the number of shipments by product category.
- Shipping Cost by Month: A monthly breakdown of shipping costs.
- Avg. Transit Time (days) by Destination: Displays the average transit time for shipments by destination.
- # of Shipments by Carrier: Shows the number of shipments handled by different carriers.
These charts provide valuable insights into the performance of logistics operations, helping you analyze trends and identify areas for improvement.
Click to buy Transportation & Logistics Dashboard In Google Sheets
2) Data Sheet Tab: Input and Update Shipping Data
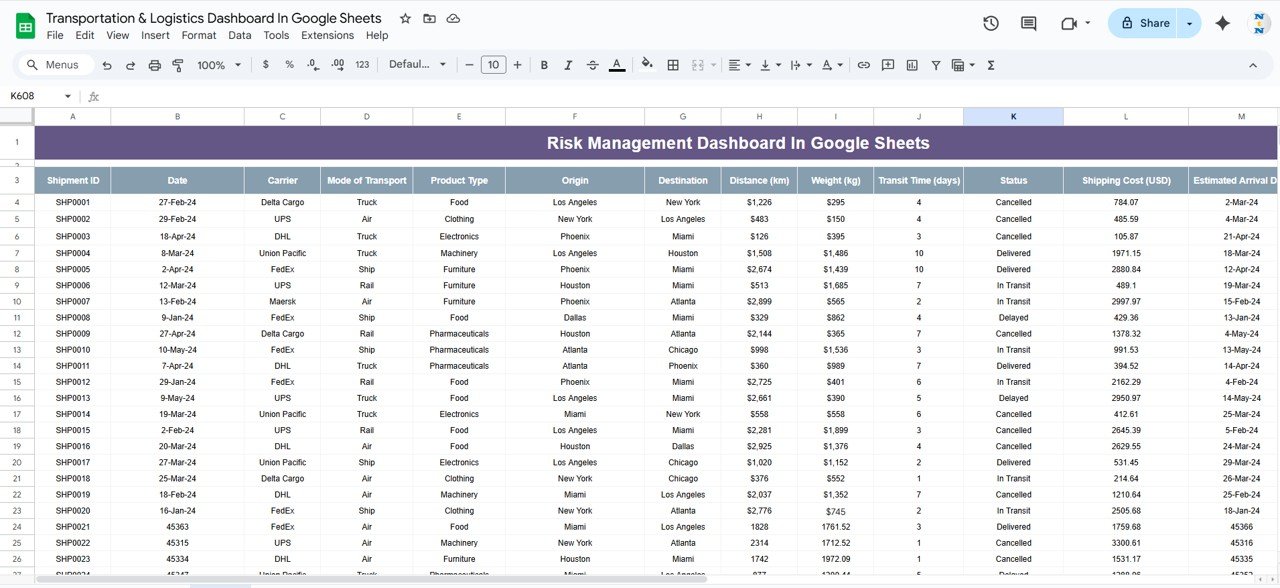
The Data Sheet Tab serves as the input sheet where all raw data is entered. This sheet allows you to capture essential shipping and transportation details. The data section includes the following columns:
- ID: A unique identifier for each shipment.
- Date: The date the shipment was processed.
- Carrier: The carrier responsible for the shipment (e.g., FedEx, DHL).
- Product Type: The type of product being shipped (e.g., electronics, clothing).
- Shipment Status: The current status of the shipment (e.g., completed, in transit, delayed).
- Shipping Cost: The cost of shipping for the specific shipment.
- Distance (km): The distance traveled by the shipment (in kilometers).
- Weight (kg): The weight of the shipment (in kilograms).
- Transit Time (days): The time taken for the shipment to reach its destination (in days).
- Destination: The destination country or region of the shipment.
This sheet allows you to enter all relevant shipping details, which will then be automatically reflected in the Dashboard Sheet Tab, updating the charts and cards accordingly.
Click to buy Transportation & Logistics Dashboard In Google Sheets
Benefits of Using the Transportation & Logistics Dashboard
The Transportation & Logistics Dashboard offers several benefits that can help streamline your logistics and shipping operations:
-
Comprehensive Overview: Provides a clear overview of key metrics such as shipment volume, shipping costs, and transit times, helping you stay on top of logistics operations.
-
Data-Driven Decisions: The dashboard’s visual charts help you analyze trends and make informed decisions to optimize logistics performance and reduce costs.
-
Easy Monitoring of Key KPIs: The dashboard tracks essential KPIs like shipping cost, distance, weight, and transit time, making it easy to monitor performance.
-
Real-Time Data Updates: As you enter new shipping data into the Data Sheet Tab, the dashboard automatically updates with the latest information, providing real-time insights.
-
Cost Optimization: By analyzing shipping costs and transit times, the dashboard helps identify areas where costs can be reduced and efficiency can be improved.
-
Customizable: The template is fully customizable, allowing you to modify it to suit your specific needs and add more data columns or charts if necessary.
Best Practices for Using the Transportation & Logistics Dashboard
Click to buy Transportation & Logistics Dashboard In Google Sheets
To maximize the effectiveness of the Transportation & Logistics Dashboard, follow these best practices:
- Regularly Update the Data: Ensure that the data in the Data Sheet Tab is updated regularly to reflect the most current shipping information.
- Monitor Key Metrics: Focus on the most important KPIs, such as shipping cost, distance, and transit time, to ensure that your logistics operations are on track.
- Use the Charts for Trend Analysis: Regularly review the charts to analyze trends and identify any areas that need improvement, such as high shipping costs or long transit times.
- Compare Data Over Time: Use the Shipping Cost by Month chart to track shipping costs over time and identify seasonal trends or anomalies.
- Collaborate with Your Team: Share the dashboard with team members to collaborate in real-time and ensure that all departments are aligned with logistics goals.
Conclusion
The Transportation & Logistics Dashboard in Google Sheets is an essential tool for any organization involved in shipping and logistics. By providing real-time tracking, visual insights, and detailed analysis, this dashboard helps optimize transportation processes, reduce costs, and improve operational efficiency. Whether you’re tracking shipments, shipping costs, or transit times, this tool allows you to make data-driven decisions that enhance your logistics operations.
Frequently Asked Questions (FAQs)
Click to buy Transportation & Logistics Dashboard In Google Sheets
1. How often should I update the Transportation & Logistics Dashboard?
It’s recommended to update the dashboard regularly, at least weekly or after each shipment, to ensure real-time tracking and decision-making.
2. Can I customize the dashboard to fit my specific logistics needs?
Yes, the dashboard is fully customizable. You can add more charts, modify KPIs, or adjust the data columns to suit your specific needs.
3. Can I track shipments from multiple carriers?
Yes, the dashboard allows you to track shipments from multiple carriers. The Carrier column in the Data Sheet Tab lets you specify which carrier is handling each shipment.
4. How can I analyze trends in shipping costs?
Use the Shipping Cost by Month chart to track shipping costs over time, allowing you to spot trends, seasonal fluctuations, or areas for cost optimization.
5. Is the dashboard suitable for businesses of all sizes?
Yes, the dashboard can be adapted to fit businesses of all sizes, from small companies with a few shipments to large enterprises with a high volume of logistics operations.
Visit our YouTube channel to learn step-by-step video tutorials
Youtube.com/@NeotechNavigators
Click to buy Transportation & Logistics Dashboard In Google Sheets