Managing a used car business without clear performance tracking often leads to missed targets, slow decisions, and reduced profitability. Sales volume, revenue, margins, inventory turnover, and conversion rates change every month—and tracking them manually becomes overwhelming.Used Car Sales KPI Dashboard in Google Sheets
That is exactly why the Used Car Sales KPI Dashboard in Google Sheets is a powerful, ready-to-use solution. It transforms raw sales numbers into clear KPIs, trends, and performance indicators that help dealerships and sales managers stay in full control.Used Car Sales KPI Dashboard in Google Sheets
This dashboard is fully interactive, easy to customize, and designed for monthly (MTD) and yearly (YTD) performance monitoring.
What Is Used Car Sales KPI Dashboard in Google Sheets?
The Used Car Sales KPI Dashboard in Google Sheets is a centralized performance monitoring tool built to track and analyze key sales metrics for used car dealerships. Instead of checking multiple sheets and reports, all KPIs are available in one structured dashboard.
Because it is built in Google Sheets, the dashboard offers:
-
Easy data entry
-
Automatic calculations
-
Visual indicators (arrows & traffic lights)
-
Cloud-based access
As a result, sales teams can instantly identify trends, gaps, and opportunities.
Key Features of This KPI Dashboard
Click to Buy Used Car Sales KPI Dashboard in Google Sheets
-
Tracks 10 essential Used Car Sales KPIs
-
Interactive Month selector for dynamic updates
-
MTD & YTD Actual vs Target analysis
-
Previous Year comparison for trend tracking
-
Conditional formatting with up/down arrows
-
Dedicated KPI Trend analysis page
-
Separate sheets for Actual, Target, and Previous Year data
-
Clear KPI definitions with formulas and units
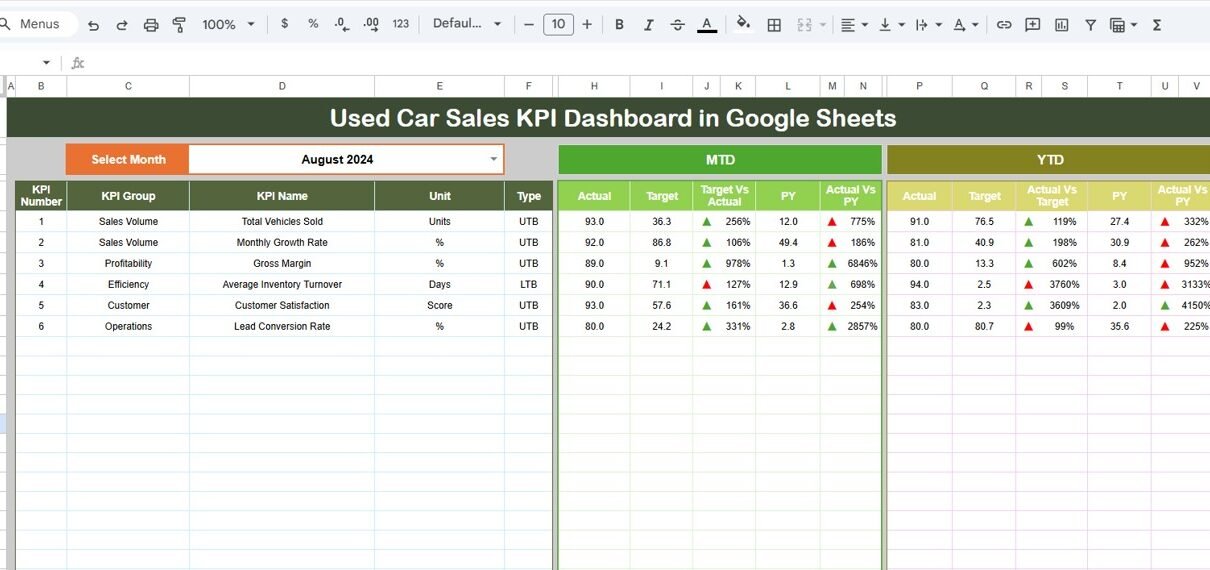
2️⃣ Dashboard Sheet Tab (Main KPI View)
This is the core dashboard page.
🔽 Month Selector
-
Located at Cell D3
-
Select any month to instantly refresh the entire dashboard
📌 KPI Metrics Displayed
For each KPI, the dashboard shows:
MTD Section
-
Actual
-
Target
-
Previous Year
-
Target vs Actual (with arrows)
-
PY vs Actual (with arrows)
YTD Section
-
Actual
-
Target
-
Previous Year
-
Target vs Actual
-
PY vs Actual
The conditional formatting makes it easy to spot:
-
✅ Performance improvement
-
⚠️ Performance decline

Click to Buy Used Car Sales KPI Dashboard in Google Sheets
KPI Trend Sheet Tab
This sheet helps analyze one KPI at a time in detail.
KPI Selector
-
Available at Cell C3
-
Select any KPI to view its details
Information Displayed
-
KPI Group
-
KPI Unit
-
KPI Type:
-
UTB (Upper the Better)
-
LTB (Lower the Better)
-
-
KPI Formula
-
KPI Definition
-
Monthly performance trend
This sheet is extremely useful for management reviews and deep-dive analysis.

Click to Buy Used Car Sales KPI Dashboard in Google Sheets
4️⃣ Actual Number Sheet Tab
This is where current year performance data is entered.
How It Works:
-
Enter MTD and YTD actual values
-
Change the month using Cell E1
-
Input the first month of the year in E1 to auto-calculate YTD logic
This keeps actual performance data clean and structured.

Click to Buy Used Car Sales KPI Dashboard in Google Sheets
5️⃣ Target Sheet Tab
Used to define monthly and yearly targets.
You Can:
-
Enter MTD Target values
-
Enter YTD Target values
-
Set realistic sales and revenue goals
Targets drive comparison logic across the dashboard.

Click to Buy Used Car Sales KPI Dashboard in Google Sheets
6️⃣ Previous Year Number Sheet Tab
This sheet stores last year’s data.
-
Same structure as Actual and Target sheets
-
Enables Year-over-Year performance comparison
-
Helps identify growth and seasonal patterns

KPI Definition Sheet Tab
This is the foundation of the KPI framework.
Columns Included:
- KPI Name
- KPI Group (Sales, Revenue, Inventory, Efficiency, etc.)
- Unit (USD, %, Count, Days)
- Formula (simple and clear)
- KPI Definition
- KPI Type (UTB / LTB)
This ensures standardization, clarity, and audit readiness.

Click to Buy Used Car Sales KPI Dashboard in Google Sheets
Advantages of Using This Dashboard
-
Centralized KPI tracking
-
Faster decision-making
-
Clear performance visibility
-
Reduced manual reporting effort
-
Easy monthly and yearly comparison
Best Practices for Use
-
Update Actual data at month-end
-
Review KPI Trend sheet during sales meetings
-
Set realistic targets aligned with inventory
-
Use color indicators for quick performance checks
-
Keep KPI definitions standardized
Who Should Use This Dashboard?
Click to Buy Used Car Sales KPI Dashboard in Google Sheets
-
Used Car Dealership Owners
-
Sales Managers
-
Automotive Analysts
-
Finance & Operations Teams
-
Small and Mid-size Auto Dealers
Final Thoughts
The Used Car Sales KPI Dashboard in Google Sheets is a practical, professional, and highly effective tool for monitoring dealership performance. It brings structure, clarity, and insight into used car sales operations—without complex software or BI tools.
Visit our YouTube channel to learn step-by-step video tutorials
Youtube.com/@NeotechNavigators
Watch the step-by-step video tutorial: