In the fast-evolving world of veterinary healthcare, data plays a crucial role in improving patient care, staff performance, and business profitability. Veterinary clinics handle multiple processes every day — from appointments and treatments to billing and client communication. Without proper tracking, it becomes difficult to measure success and make data-driven decisions.
That’s where the Veterinary Clinic KPI Dashboard in Google Sheets becomes your smartest assistant. This dashboard turns raw clinic data into meaningful insights that help you monitor performance, identify issues, and improve operations — all within the simplicity of Google Sheets.
This article explores everything you need to know about this dashboard — its structure, features, benefits, and best practices for implementation.
Click to buy Veterinary Clinic KPI Dashboard in Google Sheets
What Is a Veterinary Clinic KPI Dashboard in Google Sheets?
A Veterinary Clinic KPI Dashboard is a performance-tracking tool built in Google Sheets that enables veterinarians, administrators, and business owners to monitor the key performance indicators (KPIs) of their clinic.
It provides a complete view of clinical, financial, and operational data — including appointment volume, treatment success rate, patient satisfaction, average revenue per visit, and staff utilization.
By organizing this data into easy-to-read charts and visual summaries, the dashboard ensures that decision-makers can see real-time insights without needing complex analytics tools or software.
Why Veterinary Clinics Need a KPI Dashboard
Running a veterinary practice requires balancing clinical care with business efficiency. Clinics must manage multiple elements — appointments, staff productivity, patient care, revenue, and inventory — all at once.
A KPI Dashboard in Google Sheets simplifies this complexity by centralizing all metrics in one interactive view.
Here are some reasons why every modern veterinary clinic should adopt it:
- Monitor clinical and financial performance in real time
- Compare actual performance against monthly and yearly targets
- Identify underperforming areas early and take corrective action
- Measure client satisfaction and retention levels
- Improve staff productivity and operational planning
- Make data-driven decisions instead of relying on assumptions
With these benefits, the dashboard transforms your clinic into a performance-focused, growth-ready business.
Key Features of the Veterinary Clinic KPI Dashboard in Google Sheets
This dashboard has been carefully designed to balance simplicity and depth. It includes six interactive worksheet tabs, each serving a specific purpose in the performance-tracking process.
Let’s explore them in detail.
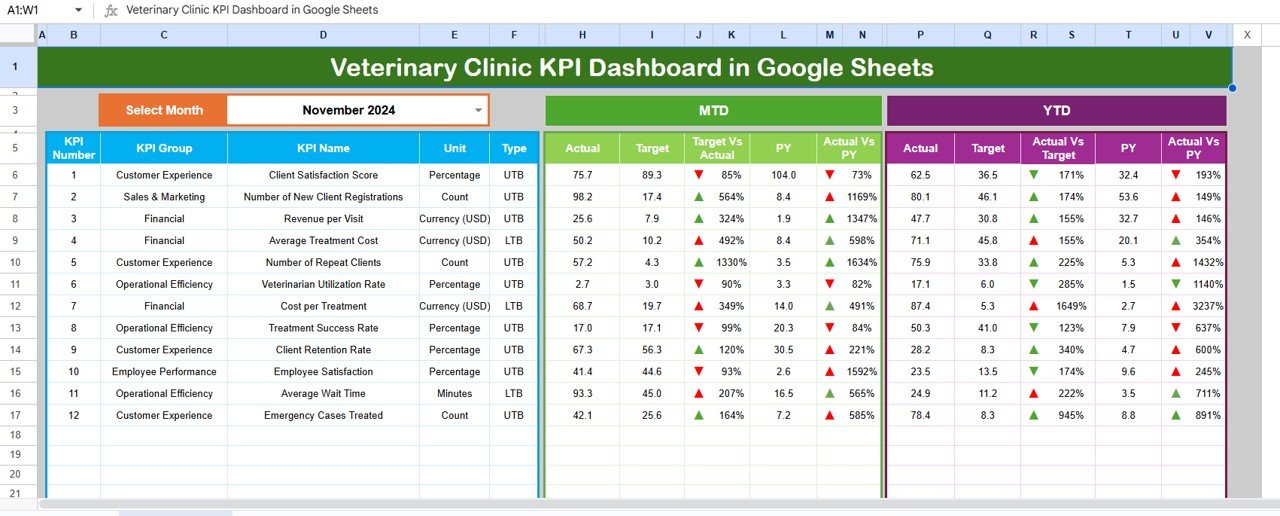
Dashboard Sheet Tab — The Main Command Center
The Dashboard sheet tab is the central page of the tool.
Here’s what makes it powerful:
- You can select the month from a drop-down in cell D3 to view Month-to-Date (MTD) data.
- The dashboard automatically updates all visuals and numbers for the selected month.
- It displays MTD and YTD Actual, Target, and Previous Year (PY) data in side-by-side comparison.
- The system also calculates Target vs Actual and PY vs Actual differences using color-coded conditional formatting (with up/down arrows).
- Users can quickly see whether the clinic’s performance is improving or declining.
This layout ensures that you can instantly interpret the health of your clinic — without analyzing hundreds of raw numbers.
Click to buy Veterinary Clinic KPI Dashboard in Google Sheets
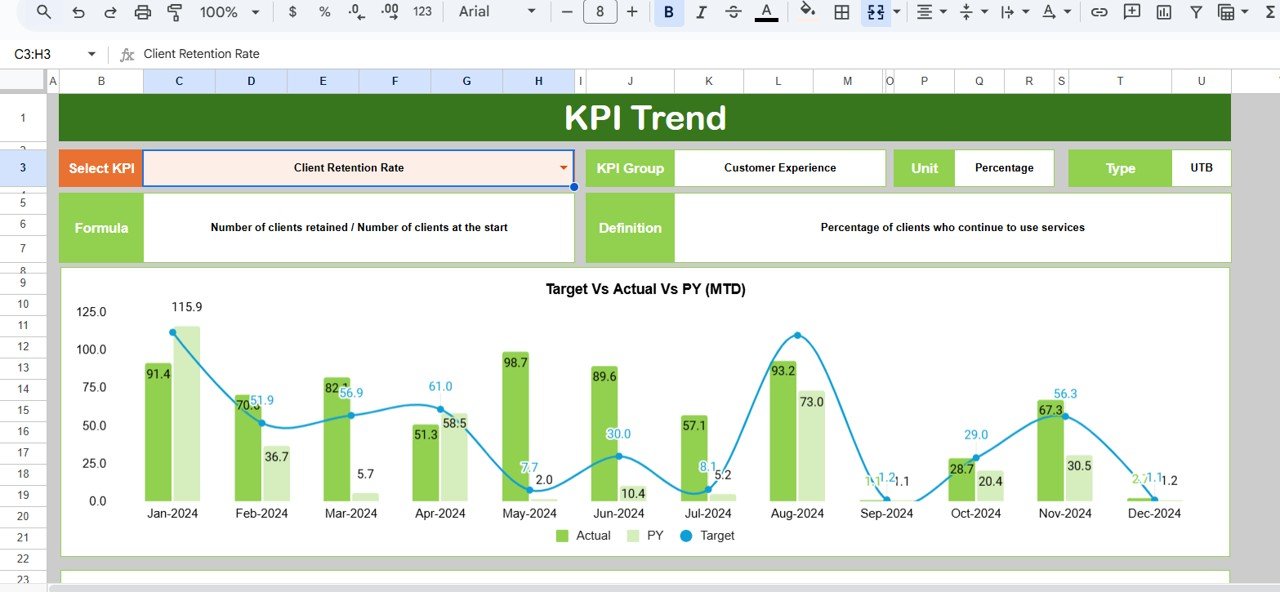
Trend Sheet Tab — Visualize KPI Performance Over Time
The Trend sheet tab lets you analyze how each KPI changes month by month.
You can:
- Select a KPI name from a drop-down list (cell C3).
- View its KPI Group, Unit, Formula, and Definition directly on the page.
- Check whether the KPI is “Upper the Better” (UTB) or “Lower the Better” (LTB).
- Visualize both MTD and YTD trend charts comparing Actual, Target, and PY data.
This helps you discover seasonal trends — for instance, rising consultation rates during specific months or declining client satisfaction after peak workload seasons.
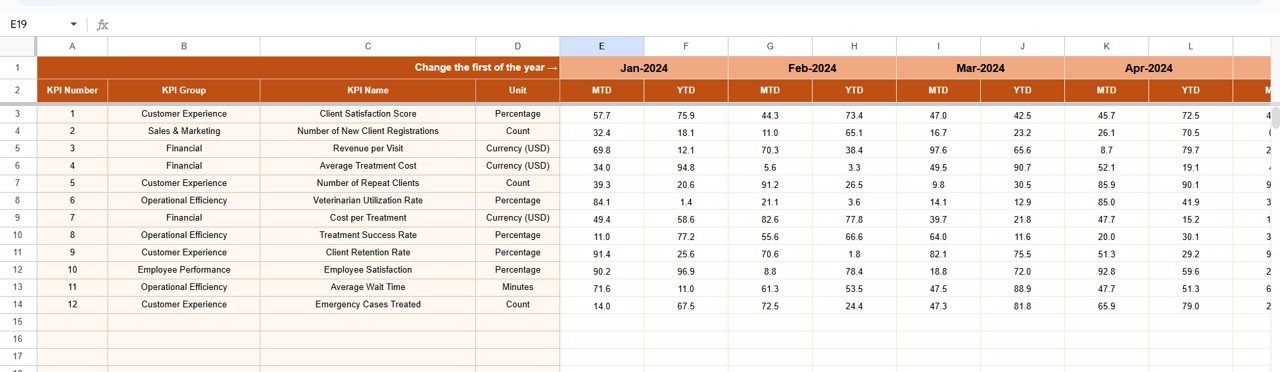
Actual Numbers Input Sheet — Enter Real Data Easily
The Actual Numbers Input sheet allows you to record monthly and yearly performance metrics.
- You can set the first month of the year in cell E1, making the sheet flexible for any fiscal cycle.
- Data is entered once, and the dashboard automatically updates across all pages.
- It captures actual values for all key performance indicators, including:
- Number of consultations
- Treatment success rate
- Average revenue per visit
- Medication stock turnover
- Client satisfaction score
This input sheet ensures your dashboard reflects real clinic performance at all times.
Click to buy Veterinary Clinic KPI Dashboard in Google Sheets
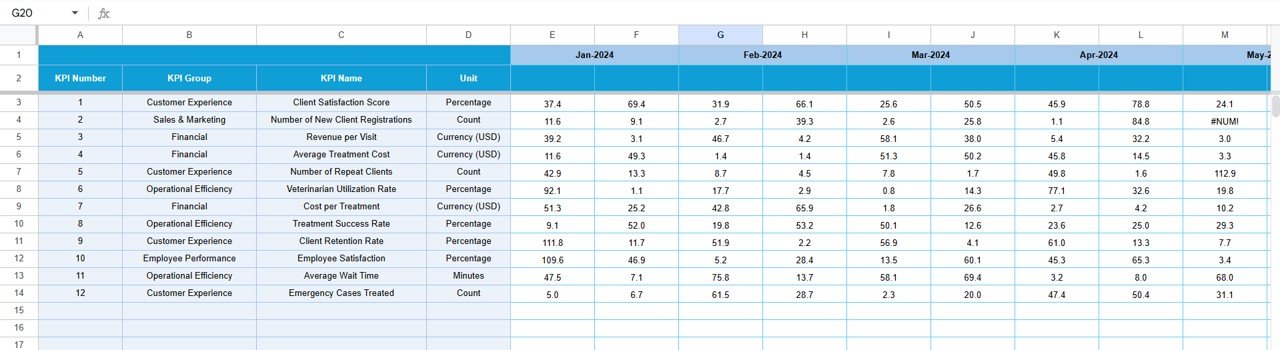
Target Sheet Tab — Set Performance Goals
Every veterinary clinic must establish realistic and measurable goals.
In the Target Sheet Tab, you can:
- Enter monthly and yearly targets for each KPI.
- Compare them directly against actual data.
- Adjust the targets as per strategic plans, marketing efforts, or seasonal demand.
This structured target-setting helps align the team with business objectives and ensures accountability.
Click to buy Veterinary Clinic KPI Dashboard in Google Sheets
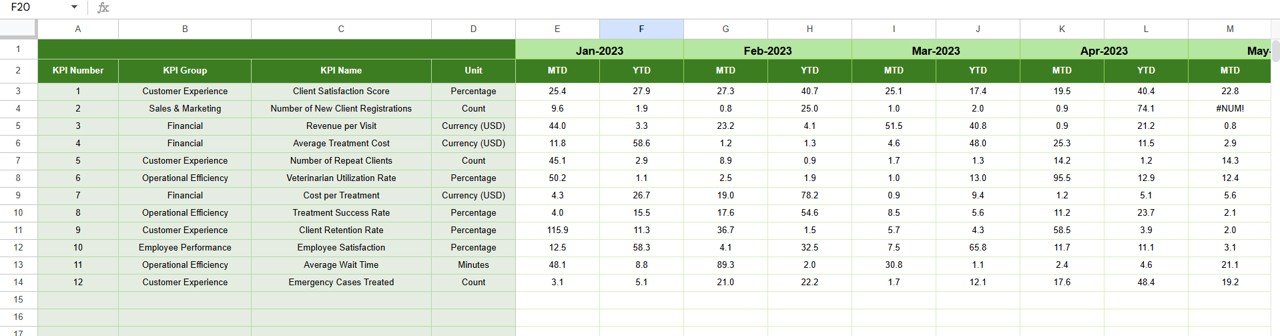
Previous Year Number Sheet — Compare Past vs Present
The Previous Year Number Sheet stores historical data.
It includes all KPIs with MTD and YTD values from the last year, allowing you to:
- Track performance trends year over year
- Identify growth patterns
- Highlight KPIs that improved or declined
This historical context is critical for long-term strategy and helps you plan future resource allocation effectively.
KPI Definition Sheet — Build Transparency and Understanding
The KPI Definition Sheet Tab is one of the most educational parts of this dashboard.
It provides:
- The KPI Name
- KPI Group (e.g., Clinical, Financial, Operational)
- Unit of Measure (%, $, Count, etc.)
- Formula Used
- Definition and Interpretation
This ensures everyone in your clinic — from veterinarians to receptionists — understands what each KPI means and how it contributes to overall performance.
🌈 How the Dashboard Helps Veterinary Clinics
The Veterinary Clinic KPI Dashboard in Google Sheets is more than a reporting tool — it’s a strategic management solution.
Here’s how it adds value across all areas of your practice:
- Enhances Decision-Making: Real-time data visualization helps managers take quick, evidence-based decisions.
- Improves Financial Control: Comparing Actual vs Target highlights overspending or missed revenue goals.
- Boosts Staff Productivity: By tracking performance KPIs, you can identify top performers and training needs.
- Increases Client Satisfaction: Continuous monitoring of feedback and waiting time ensures improved client experience.
- Supports Continuous Improvement: Historical trend data helps you evaluate the impact of process changes over time.
How to Use the Veterinary Clinic KPI Dashboard Step by Step
- Input Your Data:
- Enter actual figures in the “Actual Numbers Input” sheet.
- Add monthly targets in the “Target” sheet.
- Include last year’s data in the “Previous Year” sheet.
- Set the Month:
- Choose your desired month from the drop-down on the Dashboard sheet (cell D3).
- Review MTD and YTD Comparisons:
- Observe whether the actual numbers meet or exceed targets.
- Identify which KPIs need improvement.
- Analyze Trends:
- Use the Trend sheet to review changes over multiple months.
- Focus on consistent growth or decline.
- Update KPI Definitions:
- Customize KPI descriptions or add new ones to maintain clarity.
- Take Action:
- Use insights to create improvement plans, schedule staff meetings, or adjust strategies.
This step-by-step usage makes the dashboard accessible to everyone — even users with minimal spreadsheet knowledge.
Advantages of the Veterinary Clinic KPI Dashboard in Google Sheets
Implementing this dashboard can transform the way your veterinary clinic operates.
Here are some of the biggest advantages:
- Real-Time Insights
You no longer have to wait for end-of-month reports. The dashboard updates automatically when you add new data.
- Easy to Use
Built entirely in Google Sheets, it requires no coding or advanced Excel skills. Anyone can use it.
- Cloud-Based Collaboration
Multiple team members can work on the same file simultaneously — ideal for multi-branch clinics.
- Cost-Effective Solution
Unlike expensive BI tools, Google Sheets is free, making this dashboard a high-value, low-cost solution.
- Fully Customizable
Add, remove, or modify KPIs based on your clinic’s goals. You can also change visual styles or formulas.
- Improved Accountability
By defining ownership for each KPI, you ensure responsibility and transparency across departments.
- Enhanced Performance Monitoring
The dashboard provides both MTD and YTD comparisons, helping you maintain consistent growth and identify weak spots early.
Best Practices for Using the Veterinary Clinic KPI Dashboard
To get the most out of this dashboard, follow these proven best practices:
Keep Your Data Updated
Input actual data at least once a week. This ensures that your insights remain current and reliable.
Review KPIs Monthly
Conduct monthly review meetings using the dashboard visuals. Discuss progress with your team and make informed decisions.
Focus on Actionable KPIs
Avoid tracking too many indicators. Choose 10–15 that directly impact your clinic’s success.
Define Clear Targets
Set achievable yet challenging goals. Unrealistic targets can demotivate your team.
Maintain Data Accuracy
Ensure every entry is validated and consistent across all sheets.
Use Conditional Formatting Wisely
Color indicators and arrows make the data visually appealing and easy to interpret.
Backup Your File
Use Google Drive’s version history or download backups regularly to prevent data loss.
By following these practices, you can maintain a reliable, insightful, and efficient reporting system.
Future Enhancements and Integrations
Although this dashboard is already powerful, you can further enhance it by integrating:
- Google Forms: To collect client feedback and automatically update satisfaction KPIs.
- Google Data Studio or Looker Studio: To create advanced visual reports.
- Automated Scripts: To update data from appointment or billing software.
Such integrations can elevate your clinic’s data analytics capabilities to the next level.
Conclusion
The Veterinary Clinic KPI Dashboard in Google Sheets empowers veterinary professionals to transform raw data into actionable insights.
It bridges the gap between clinical excellence and business performance — helping you monitor efficiency, improve client satisfaction, and increase profitability.
Simple yet powerful, this dashboard is your all-in-one companion for growth, decision-making, and success in the veterinary industry.
Frequently Asked Questions (FAQs)
- What is the main purpose of a Veterinary Clinic KPI Dashboard?
- The dashboard helps track and analyze key clinical, operational, and financial metrics in one place, providing real-time visibility into the clinic’s performance.
- Can I customize the KPIs in this dashboard?
- Yes, all KPIs are fully customizable. You can add, remove, or edit KPIs to fit your clinic’s goals and services.
- Does this dashboard require advanced Google Sheets skills?
- No. It’s designed for all users. Basic spreadsheet knowledge is enough to operate and modify it.
- How often should I update the data?
- Weekly updates are ideal for accuracy, but monthly updates also work if your clinic handles consistent data volumes.
- Can I share the dashboard with my team?
- Absolutely. Since it’s built in Google Sheets, you can easily share it with staff and control their access permissions.
- What if I have multiple clinic branches?
- You can add branch-specific data and use filters or slicers to compare performance across locations.
- Is there a way to visualize trends automatically?
- Yes, the Trend sheet includes dynamic charts that show Actual vs Target vs Previous Year trends for MTD and YTD.
- How does this dashboard improve client satisfaction?
- By tracking metrics like waiting time, follow-ups, and feedback scores, you can identify and fix service issues quickly.
- Can I export reports from the dashboard?
- Yes, you can export charts or summary tables as PDFs or images for presentations and reports.
- What makes this tool better than other software?
It’s cost-effective, simple, cloud-based, and requires no installation — making it ideal for clinics of all sizes.
Visit our YouTube channel to learn step-by-step video tutorials
Youtube.com/@NeotechNavigators
Watch the step-by-step video tutorial:
Click to buy Veterinary Clinic KPI Dashboard in Google Sheets