Managing a warehouse efficiently is critical for businesses to maintain smooth operations, optimize costs, and enhance productivity. One of the most effective ways to ensure that everything is running smoothly is through the use of Key Performance Indicators (KPIs). A Warehouse Management KPI Dashboard in Google Sheets can provide real-time insights into various warehouse functions, helping decision-makers assess performance and make data-driven adjustments.
In this article, we will guide you through the key features of the Warehouse Management KPI Dashboard template, discuss the KPIs included, explore how this dashboard helps improve warehouse operations, and provide best practices for its implementation.
What is a Warehouse Management KPI Dashboard?
A Warehouse Management KPI Dashboard is a visual representation of key performance metrics used to monitor and optimize warehouse operations. This tool tracks various KPIs related to inventory, employee productivity, order fulfillment, and more. By utilizing Google Sheets for this dashboard, you ensure easy access, real-time data updates, and seamless collaboration across teams.
Key Features of the Warehouse Management KPI Dashboard in Google Sheets
This Warehouse Management KPI Dashboard template is ready to use and can be customized to meet the specific needs of your warehouse. The dashboard contains six key worksheets that help organize and present the data clearly and efficiently.
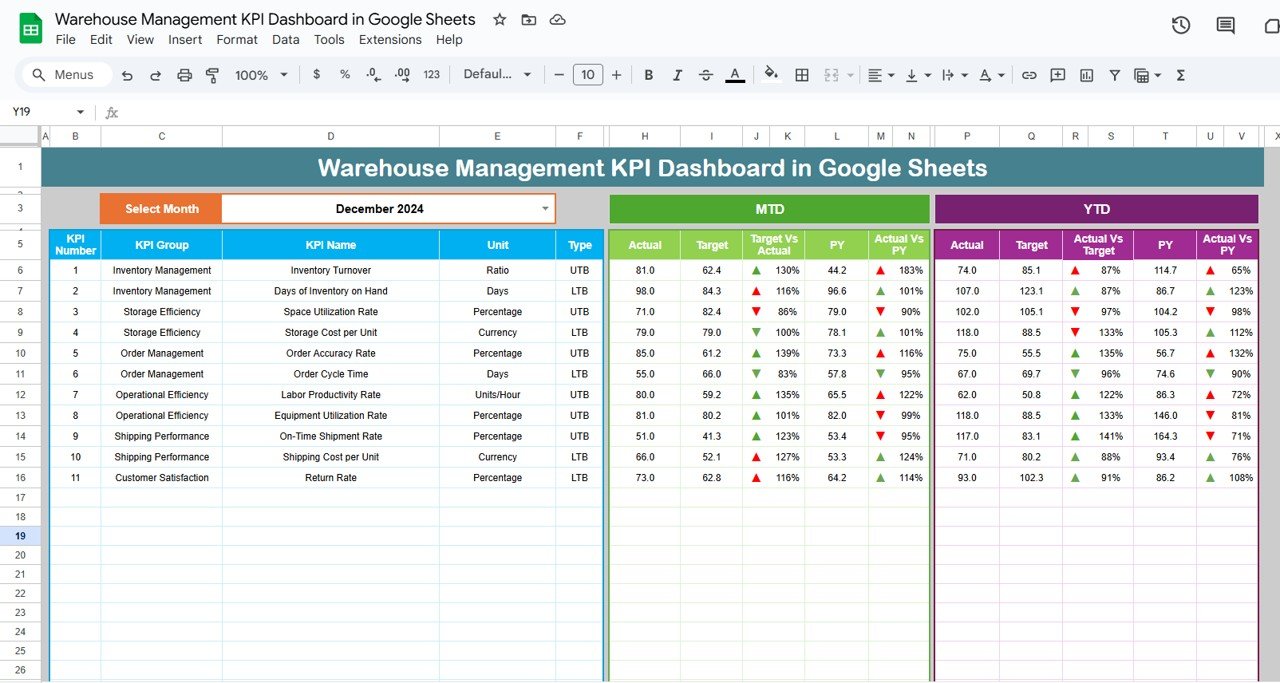
1. Dashboard Sheet Tab
The Dashboard Sheet Tab serves as the central hub of the dashboard. It displays all the information about your KPIs and allows you to quickly assess your warehouse’s performance.
-
Month Selection: The month can be selected from a dropdown menu in cell D3, allowing the dashboard to update dynamically for any month.
-
Key Data Display: The dashboard shows both Month-to-Date (MTD) and Year-to-Date (YTD) data for each KPI. Additionally, it compares actual performance with the Previous Year’s Data (PY).
-
Conditional Formatting: Using up and down arrows, the dashboard visually indicates whether the performance is improving or declining.

Click to buy Warehouse Management KPI Dashboard in Google Sheets
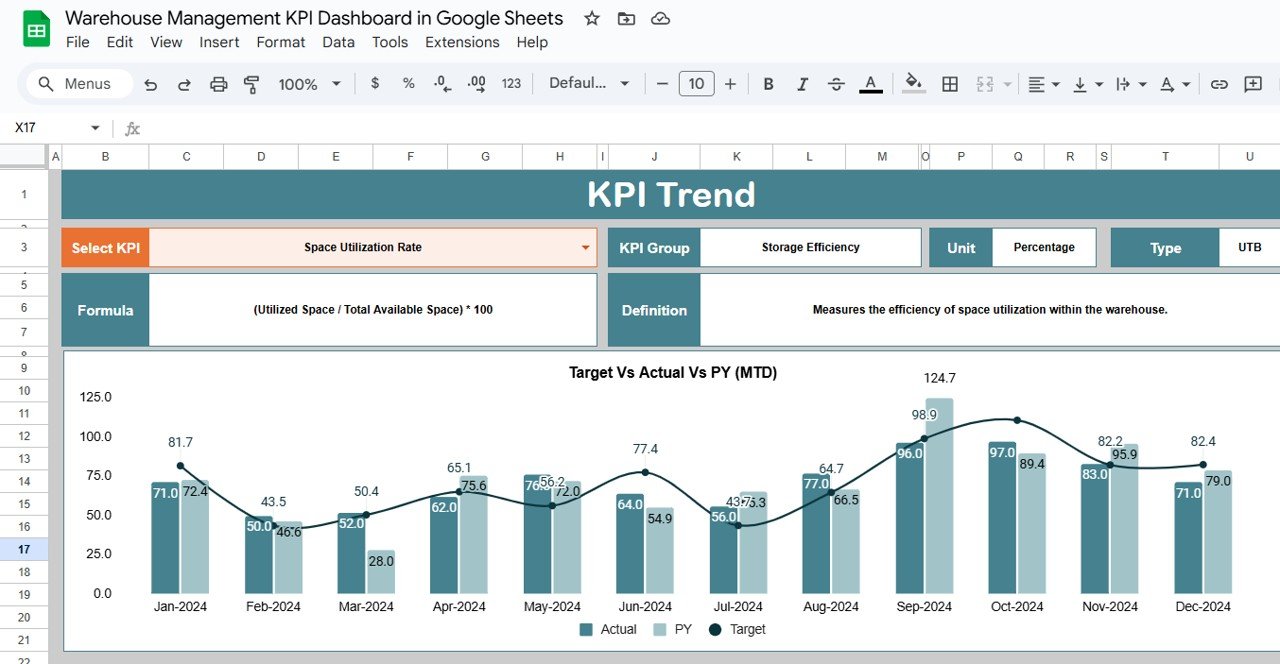
2. KPI Trend Sheet Tab
The KPI Trend Sheet helps you monitor how KPIs change over time. By selecting a specific KPI name from the dropdown menu in range C3, you can track:
-
KPI Group: Grouping KPIs based on their nature (e.g., Inventory, Order Fulfillment, Labor Productivity).
-
Unit of KPI: Each KPI is associated with a specific unit of measurement (e.g., units per hour, cost per order).
-
Formula: The formula used to calculate each KPI is displayed, allowing you to understand how each metric is derived.
-
KPI Type: Indicates whether the KPI is “Lower the Better” (LTB) or “Upper the Better” (UTB), helping you interpret the data correctly.
Click to buy Warehouse Management KPI Dashboard in Google Sheets
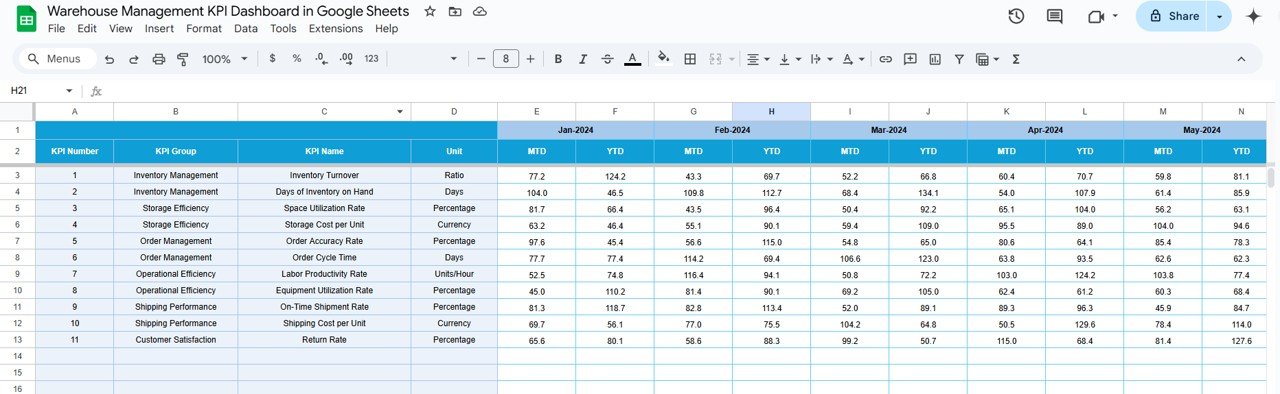
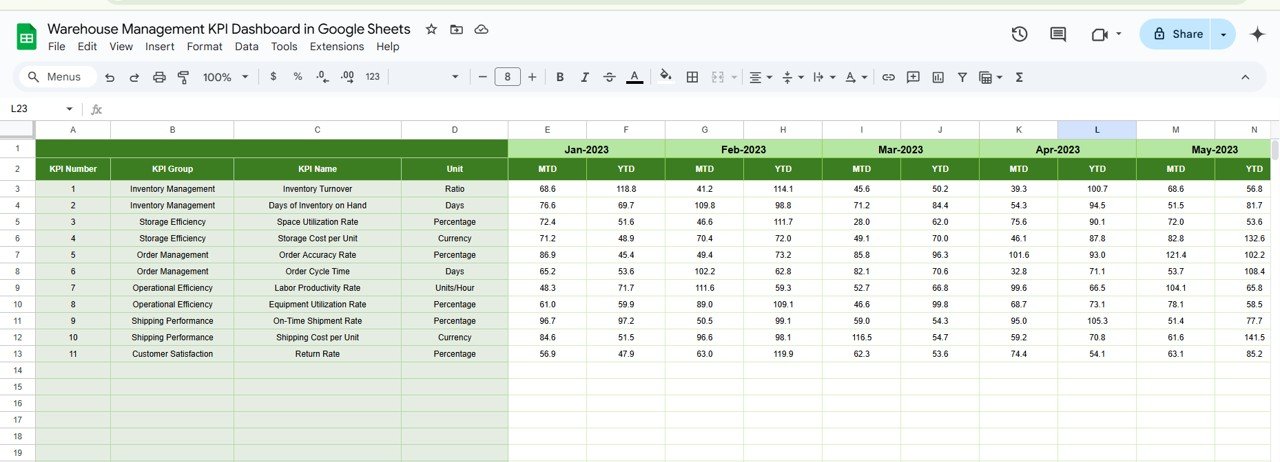
3. Actual Number Sheet Tab
In the Actual Number Sheet Tab, you enter the actual performance data for both MTD and YTD values. The month can be adjusted from the dropdown in range E1, and the data updates based on this selection.
Click to buy Warehouse Management KPI Dashboard in Google Sheets
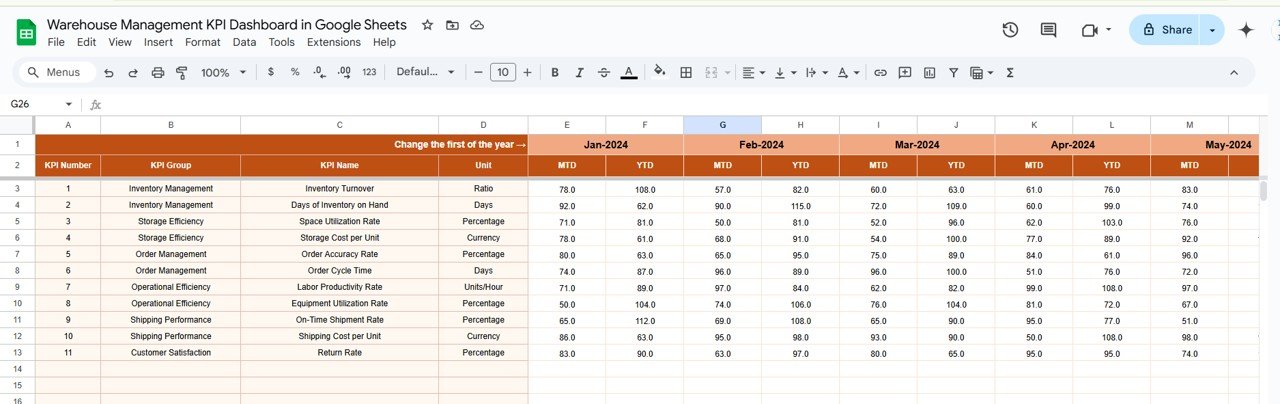
4. Target Sheet Tab
The Target Sheet Tab is where you input the target numbers for each KPI for the particular month (MTD and YTD). Setting accurate targets is crucial for measuring performance against expected goals.
5. Previous Year Number Sheet Tab
The Previous Year Number Sheet Tab allows you to enter the performance data from the previous year. This historical comparison is essential for assessing growth or regression over time.
Click to buy Warehouse Management KPI Dashboard in Google Sheets
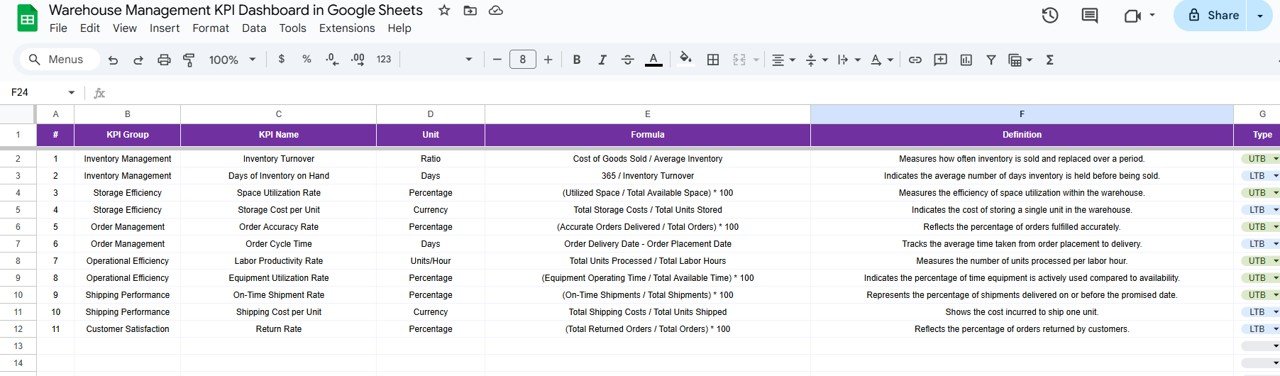
6. KPI Definition Sheet Tab
The KPI Definition Sheet Tab is where you define each KPI in detail:
-
KPI Name
-
KPI Group
-
Unit
-
Formula
-
Definition: A short, clear description of what the KPI measures.
Click to buy Warehouse Management KPI Dashboard in Google Sheets
Advantages of Using a Warehouse Management KPI Dashboard
Implementing a Warehouse Management KPI Dashboard offers several significant advantages for warehouse operations. Let’s look at some of the key benefits:
-
Real-Time Data Access: With Google Sheets, your data updates automatically, ensuring that your team always has access to the most current information.
-
Improved Decision-Making: By tracking KPIs, you can identify areas that need improvement and make informed decisions to optimize warehouse performance.
-
Increased Productivity: By monitoring KPIs related to order fulfillment, labor efficiency, and inventory accuracy, you can find ways to boost warehouse productivity.
-
Cost Optimization: The dashboard allows you to track operational costs, enabling you to identify areas where expenses can be reduced.
-
Data-Driven Insights: KPIs help convert raw data into actionable insights, giving your team the tools they need to improve warehouse operations.
Opportunities for Improvement in Warehouse Management with KPIs
Click to buy Warehouse Management KPI Dashboard in Google Sheets
While a Warehouse Management KPI Dashboard is an excellent tool for monitoring and improving warehouse performance, there are always opportunities for optimization:
-
Regular KPI Review: It’s essential to regularly evaluate the KPIs to ensure they align with the changing business objectives. Sometimes, businesses grow, and their initial KPIs might no longer be the best fit.
-
Incorporating New Data Points: As the business expands, consider incorporating additional data points into the dashboard. This might include new metrics related to customer satisfaction, delivery times, or operational costs.
-
Automation and Integration: Automating data entry into Google Sheets (e.g., through API integrations or Google Apps Script) can further reduce human error and increase efficiency.
-
Employee Training: Proper training for warehouse staff on the importance of KPIs and how to improve their performance based on data-driven insights can enhance the effectiveness of the dashboard.
Best Practices for Using the Warehouse Management KPI Dashboard
To maximize the effectiveness of the Warehouse Management KPI Dashboard, follow these best practices:
-
Set Clear, Achievable Targets: Ensure that each KPI has a realistic target based on past performance and industry benchmarks.
-
Regularly Update Data: Consistently update the actual and target data for each KPI to ensure the dashboard reflects the most current information.
-
Use Conditional Formatting Wisely: Ensure that up and down arrows are used in a way that makes sense for the specific KPI. This helps the team easily spot areas that need attention.
-
Review and Adjust KPIs Periodically: As your warehouse grows or changes, you may need to adjust the KPIs or the target values to remain aligned with business objectives.
-
Ensure Data Accuracy: Accuracy is crucial when entering data into the dashboard. Double-check numbers to ensure that the insights generated are reliable.
-
Leverage Historical Data: Use the previous year’s data to identify long-term trends and evaluate whether your warehouse is improving or regressing over time.
Conclusion
Click to buy Warehouse Management KPI Dashboard in Google Sheets
A Warehouse Management KPI Dashboard in Google Sheets is an essential tool for any warehouse looking to improve its operations. With its easy-to-use interface, real-time data tracking, and the ability to analyze performance across various KPIs, this dashboard helps warehouse managers make informed decisions. By using this template, you gain better control over your warehouse’s efficiency, reduce costs, and ultimately enhance customer satisfaction.
Frequently Asked Questions (FAQ)
1. What KPIs should be included in a Warehouse Management KPI Dashboard?
Key KPIs include inventory turnover, order picking accuracy, order fulfillment cycle time, warehouse space utilization, and employee productivity.
2. How can I modify the Warehouse Management KPI Dashboard for my specific warehouse?
You can easily modify the template by changing the KPIs, adjusting the target data, and adding custom formulas specific to your warehouse’s needs.
3. Can I integrate the KPI Dashboard with other software?
Yes, you can integrate Google Sheets with other tools like your ERP system using APIs or Google Apps Script for seamless data synchronization.
4. How do I enter the data into the Warehouse Management KPI Dashboard?
Data can be entered manually in the Actual Number Sheet Tab and Target Sheet Tab. It’s important to update both MTD and YTD data regularly.
5. How often should I update the data in the Warehouse Management KPI Dashboard?
The data should be updated regularly, ideally at the end of each day or week, depending on the frequency of your warehouse operations.
Visit our YouTube channel to learn step-by-step video tutorials
Youtube.com/@NeotechNavigators
Watch the step-by-step video Demo:
Click to buy Warehouse Management KPI Dashboard in Google Sheets

