Wind energy has become one of the fastest-growing sources of renewable energy globally, and managing its performance effectively is key to achieving sustainability goals. A Wind Energy KPI Dashboard helps organizations track and evaluate critical performance metrics related to wind energy generation. With this tool, you can monitor essential KPIs such as energy production, efficiency, maintenance, and financial performance.
The Wind Energy KPI Dashboard in Google Sheets is a comprehensive, ready-to-use template that offers an organized and easy-to-use platform for tracking the key performance indicators (KPIs) associated with wind energy. This article will guide you through the features of the Wind Energy KPI Dashboard, provide insights into the KPIs it tracks, and demonstrate how this dashboard can help optimize wind energy operations.
What is the Wind Energy KPI Dashboard?
The Wind Energy KPI Dashboard is a tool that consolidates key metrics related to the performance of wind energy systems. It allows stakeholders to track important data such as energy generation, system efficiency, operational costs, and sustainability metrics. The dashboard is built on Google Sheets, offering flexibility, real-time updates, and collaborative features for teams working across multiple locations.
The Google Sheets template can be easily customized to suit your specific needs, whether you’re managing a single wind turbine or a large wind farm.
Key Features of the Wind Energy KPI Dashboard in Google Sheets
The Wind Energy KPI Dashboard includes several worksheets, each designed to track specific KPIs related to wind energy performance. Below is a breakdown of the dashboard’s core features:
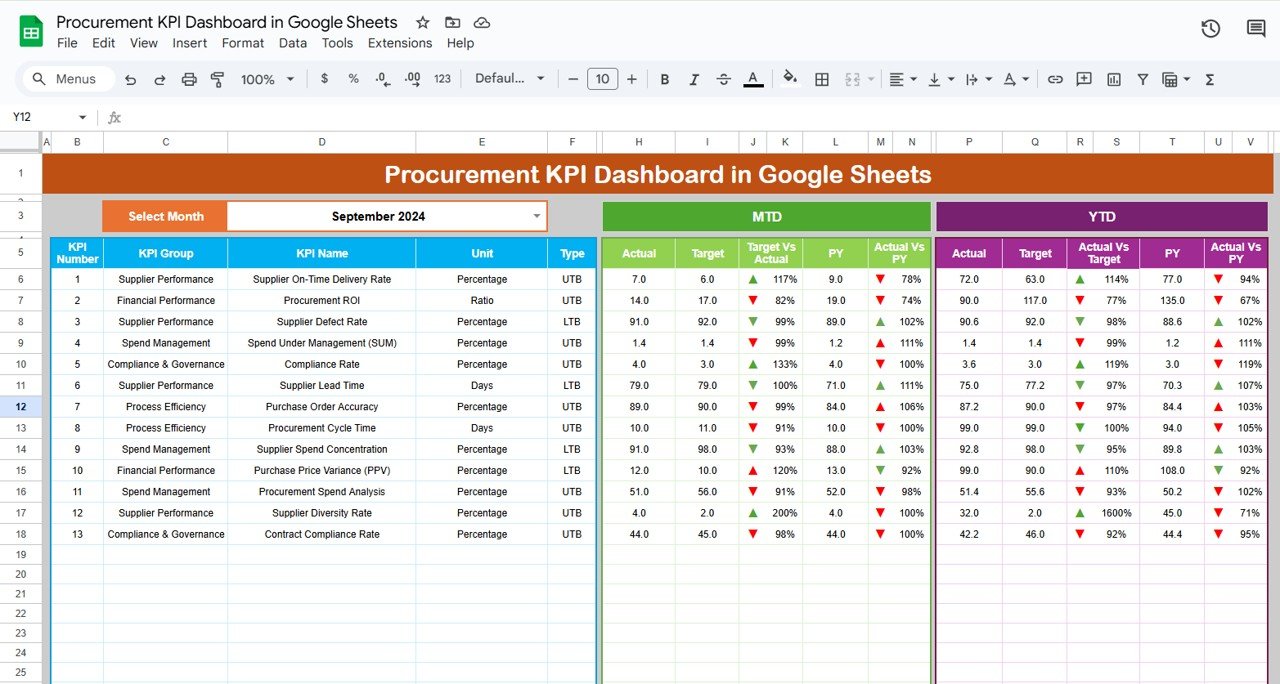
1. Dashboard Sheet Tab
The Dashboard Sheet is the central hub where all the KPIs are displayed. It provides a visual overview of the most important performance metrics.
Month Dropdown (D3): You can select a specific month, and the entire dashboard will update to display data for that period.
Key Metrics:
- MTD Actual, Target, Previous Year Data: Displays actual performance for the current month compared to the target and previous year’s data.
- YTD Actual, Target, Previous Year Data: Tracks year-to-date performance and compares it with targets and last year’s data.
Conditional Formatting: Conditional formatting with up and down arrows visually shows whether each KPI is meeting or missing the target for both MTD and YTD data.

Click to buy Wind Energy KPI Dashboard in Google Sheets
2. KPI Trend Sheet Tab
The KPI Trend Sheet is used to analyze performance trends over time:
-
KPI Selection Dropdown (C3): Select any KPI from the dropdown, and the sheet will display the trend for that specific KPI over the last several months.
-
KPI Group, Unit, Type: Displays the KPI’s group (e.g., energy generation, operational costs), unit of measurement (e.g., kilowatts, dollars), and whether the KPI is “Lower the Better” (LTB) or “Upper the Better” (UTB).
-
Formula and Definition: Shows the formula for calculating the KPI and provides a detailed explanation of what it measures.
-

- KPI Trend Sheet Tab
3. Actual Numbers Sheet Tab
Click to buy Wind Energy KPI Dashboard in Google Sheets
In this sheet, you enter the actual performance data for the month:
-
MTD and YTD Data: Input the actual values for each KPI for the current month and year-to-date.
-
Month Selection (E1): Select the first month of the year to update the data automatically across the dashboard.

4. Target Sheet Tab
The Target Sheet allows you to enter target values for each KPI:
-
Monthly and YTD Targets: Enter the target values for each KPI, which will then be compared against actual data to track performance.

Click to buy Wind Energy KPI Dashboard in Google Sheets
5. Previous Year Number Sheet Tab
This sheet is where you input data for the previous year:
-
Historical Comparison: By entering previous year’s data, you can compare the current year’s performance to last year’s figures, which helps identify trends and areas for improvement.

6. KPI Definition Sheet Tab
The KPI Definition Sheet is where each KPI is clearly defined:
-
KPI Name, Group, Unit: Defines each KPI’s name, group (e.g., production, maintenance), and unit of measurement.
-
Formula and Definition: Provides the formula and a clear explanation of how each KPI is calculated and its significance.

Click to buy Wind Energy KPI Dashboard in Google Sheets
Advantages of Using the Wind Energy KPI Dashboard
The Wind Energy KPI Dashboard provides several benefits:
- Real-Time Monitoring: Track key performance indicators in real time, allowing for proactive management and optimization.
- Visual Representation: Use charts and visual cues like up and down arrows to quickly assess the performance of each KPI.
- Financial Tracking: Monitor financial metrics such as cost per kWh and ROI to ensure that the wind energy system is cost-effective.
- Trend Analysis: Analyze trends over time, allowing for better long-term planning and decision-making.
- Efficiency Optimization: The dashboard helps identify areas where energy production or operational costs can be improved.
Opportunity for Improvement in the Wind Energy KPI Dashboard
While the Wind Energy KPI Dashboard is a robust tool, there are opportunities to enhance it:
-
Automation: Automating data entry by integrating with energy monitoring systems can reduce the need for manual updates and ensure more accurate data.
-
Predictive Analytics: Incorporating predictive analytics could help forecast future energy production and efficiency, allowing for more strategic planning.
-
Mobile Compatibility: Making the dashboard mobile-friendly would allow users to track wind energy performance while on the go.
-
Advanced Reporting: Adding an automated reporting feature for monthly or quarterly summaries would save time and improve efficiency.
Best Practices for Using the Wind Energy KPI Dashboard
Click to buy Wind Energy KPI Dashboard in Google Sheets
To maximize the benefits of the Wind Energy KPI Dashboard, follow these best practices:
-
Update Regularly: Keep the data updated to ensure that you’re tracking the most current performance metrics.
-
Set Realistic Targets: Establish achievable targets based on historical performance and industry benchmarks.
-
Analyze Trends: Regularly review the trend analysis to identify areas for improvement and ensure consistent performance.
-
Focus on High-Impact KPIs: Prioritize KPIs that have the most significant impact on your energy production and financial performance.
-
Collaborate Across Teams: Share the dashboard with key stakeholders to ensure everyone is aligned on performance goals and objectives.
Conclusion
The Wind Energy KPI Dashboard in Google Sheets is an essential tool for monitoring and optimizing the performance of wind energy systems. By tracking key metrics such as energy production, cost efficiency, and ROI, this dashboard helps stakeholders make informed decisions to improve operational performance, reduce costs, and maximize the environmental benefits of wind energy. With its user-friendly interface and customizable features, the dashboard offers a comprehensive solution for managing wind energy performance and ensuring that goals are met.
Frequently Asked Questions (FAQs)
Click to buy Wind Energy KPI Dashboard in Google Sheets
1. What KPIs does the Wind Energy KPI Dashboard track?
The dashboard tracks KPIs such as total energy generated, energy efficiency, maintenance costs, capacity factor, and ROI.
2. How do I update the Wind Energy KPI Dashboard?
You can update the dashboard by entering actual performance data in the Actual Numbers Sheet and setting targets in the Target Sheet.
3. Can I customize the Wind Energy KPI Dashboard?
Yes, the dashboard is fully customizable. You can add new KPIs, modify formulas, and adjust the layout to meet your specific needs.
4. How often should I update the data in the Wind Energy KPI Dashboard?
It’s recommended to update the data regularly (e.g., weekly or monthly) to ensure it reflects the most accurate performance metrics.
5. Can the Wind Energy KPI Dashboard be automated?
Yes, you can integrate the dashboard with energy monitoring systems to automate data entry and improve accuracy.
Visit our YouTube channel to learn step-by-step video tutorials
Youtube.com/@NeotechNavigators