Ensuring workplace safety is a top priority for every organization. Managing incidents, tracking their severity, and taking preventive measures not only protect employees but also improve organizational efficiency and compliance. The Workplace Safety & Incident Management Dashboard in Google Sheets is a ready-to-use tool designed to help safety managers and HR professionals monitor, analyze, and improve workplace safety performance with ease.
In this article, we’ll cover its structure, KPIs, features, and how it helps organizations strengthen safety management systems.
What Is a Workplace Safety & Incident Management Dashboard?
A Workplace Safety & Incident Management Dashboard is a centralized system for recording and tracking workplace incidents, assessing their severity, and monitoring preventive actions.
Built in Google Sheets, this dashboard provides:
Interactive charts and KPIs.
Month-to-date (MTD) and year-to-date (YTD) comparisons.
Automatic conditional formatting with color codes and arrows.
Department-wise and category-wise insights for better decision-making.
It’s perfect for safety officers, operations managers, and compliance teams who need real-time visibility into safety metrics and incident trends.
Structure of the Dashboard
Click to Buy Workplace Safety & Incident Management Dashboard in Google Sheets
The Workplace Safety & Incident Management Dashboard in Google Sheets includes the following key sheet tabs:
Dashboard Sheet Tab
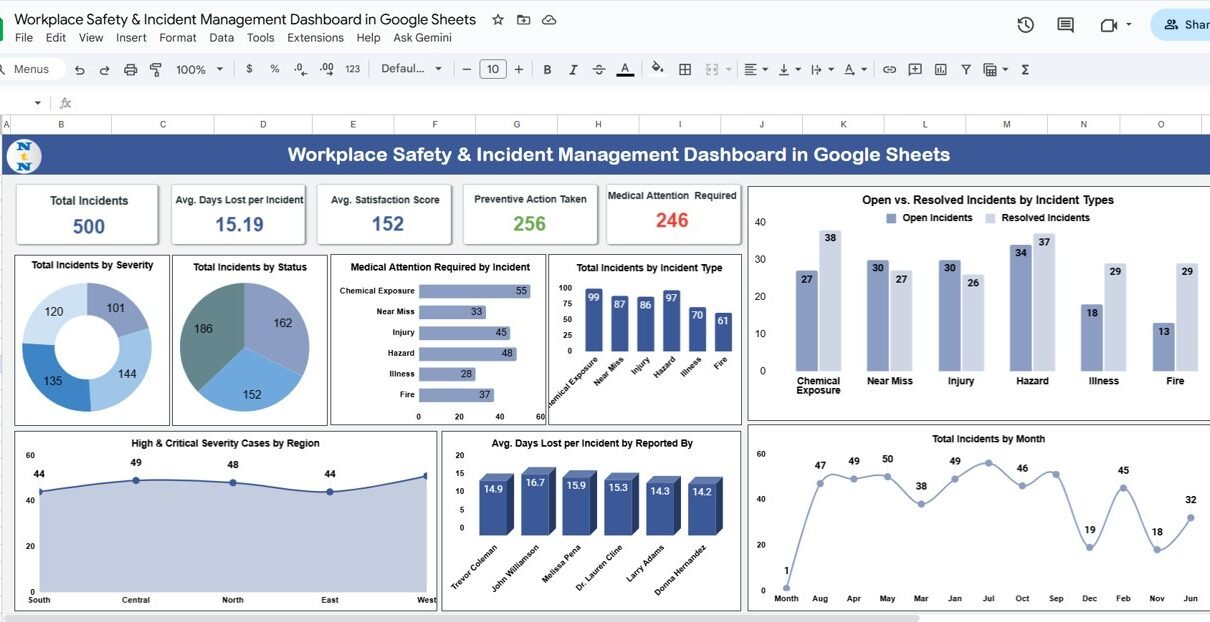
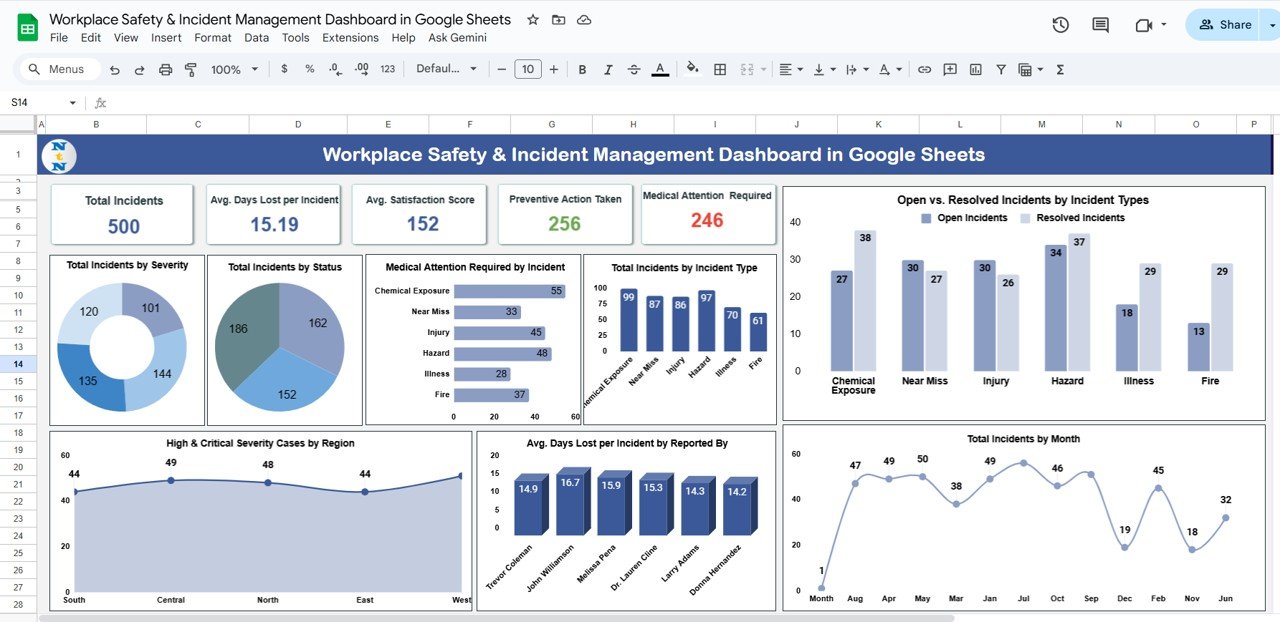
This is the main dashboard where all workplace safety KPIs and charts are displayed. The data automatically updates as you change the reporting month or add new records.
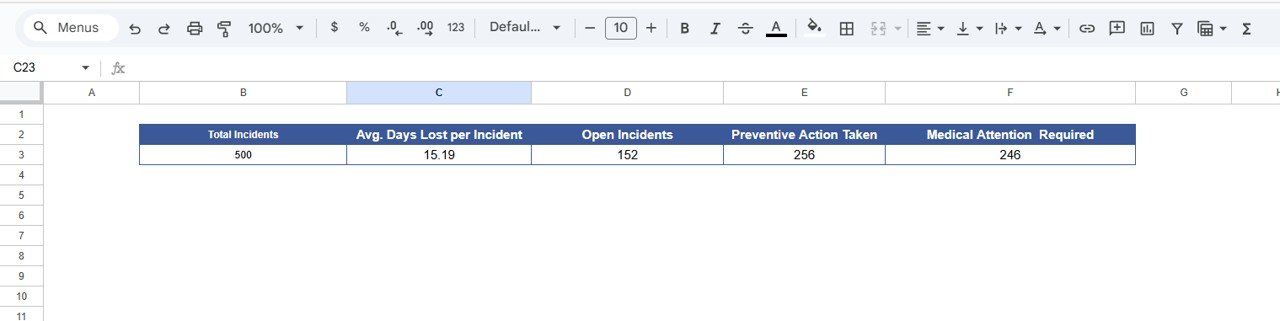
Cards Displayed:
-
Total Incidents: Total number of safety incidents reported.
-
Avg. Days Lost per Incident: Average workdays lost due to each incident.
-
Open Incidents: Number of unresolved or pending incidents.
-
Preventive Actions Taken: Number of preventive or corrective actions completed.
-
Medical Attention Required: Count of incidents that required medical treatment.
Charts Included:
Click to Buy Workplace Safety & Incident Management Dashboard in Google Sheets
-
Total Incidents by Severity Level – Breaks down incidents into Low, Medium, High, and Critical severity levels.
-
Total Incidents by Status – Tracks progress (Open, Resolved, Under Review).
-
Medical Attention Required by Incident – Visualizes incidents that required healthcare support.
-
Total Incidents by Incident Type – Categorizes by type (Injury, Property Damage, Near Miss, etc.).
-
Open vs. Resolved Incidents by Type – Measures resolution performance.
-
Total Incidents by Month – Helps track monthly patterns or spikes.
-
Avg. Days Lost per Incident by Reported By – Evaluates performance of safety reporting sources.
-
High & Critical Severity Cases by Region – Identifies areas with recurring severe incidents.
These insights make it easy to pinpoint safety concerns and prioritize improvements.
Click to Buy Workplace Safety & Incident Management Dashboard in Google Sheets
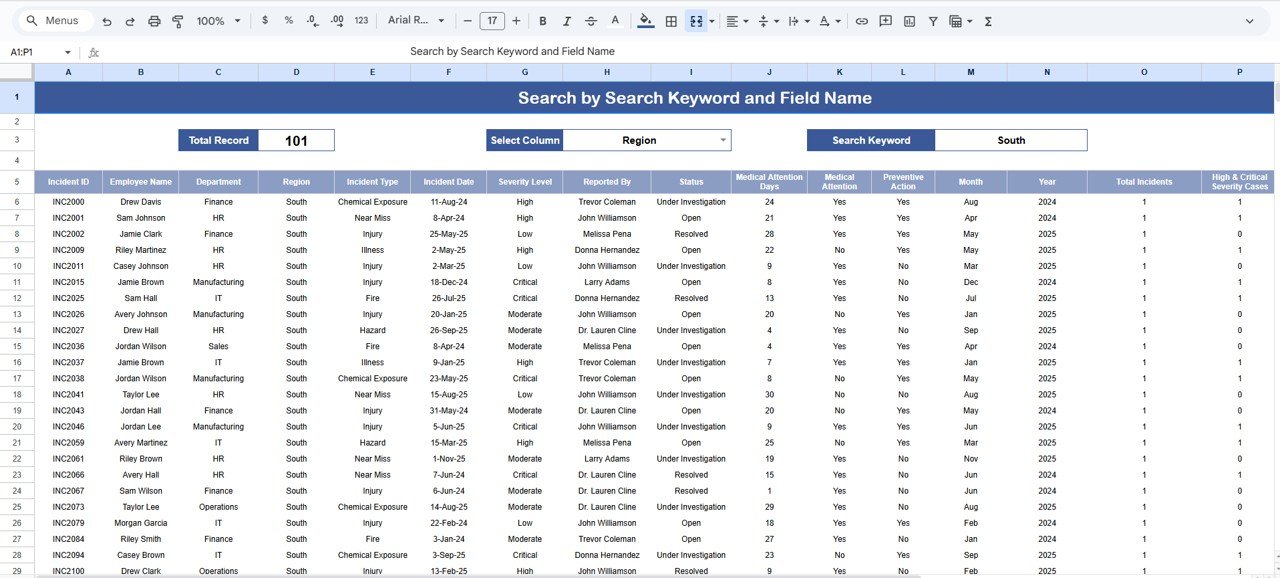
Search Sheet Tab
The Search Sheet Tab provides a quick and powerful way to find incident details using keywords.
This feature enables quick filtering without manually scrolling through large datasets.
Click to Buy Workplace Safety & Incident Management Dashboard in Google Sheets
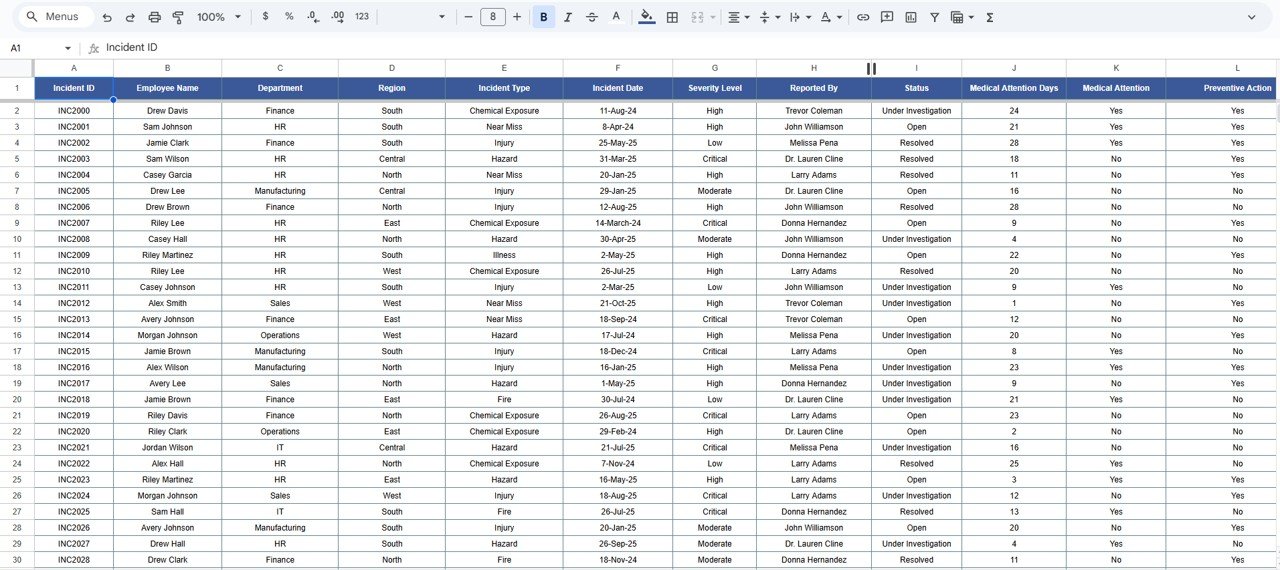
Data Sheet Tab
This sheet stores all incident records. It acts as the data source for the dashboard and charts.
Click to Buy Workplace Safety & Incident Management Dashboard in Google Sheets
Support Sheet Tab
This sheet contains lookup lists and dropdown data (e.g., departments, regions, severity levels, statuses) to ensure consistency and reduce manual entry errors.
Advantages of the Workplace Safety & Incident Management Dashboard
-
Centralized Data Tracking: Consolidates all safety incidents in one place.
-
Automated Analytics: Real-time calculation of safety metrics and trends.
-
Visual Reporting: Easy-to-read charts for leadership reporting.
-
Action-Oriented: Highlights areas that need corrective or preventive measures.
-
Cloud Collaboration: Shareable and editable across teams in Google Sheets.
Opportunities for Improvement
Enhance the dashboard by:
Click to Buy Workplace Safety & Incident Management Dashboard in Google Sheets
-
Integrating with Google Forms for live incident reporting.
-
Automating alerts via Google Apps Script for high-severity cases.
-
Adding heat maps to visualize incidents by site or region.
-
Tracking Root Cause Analysis (RCA) and action closure timelines.
-
Including incident cost analysis for financial impact reporting.
Best Practices
-
Record incidents immediately after they occur.
-
Standardize severity levels and incident types.
-
Update the status field regularly to maintain dashboard accuracy.
-
Use color-coded alerts for overdue or critical cases.
-
Conduct monthly reviews of preventive actions and outcomes.
Conclusion
Click to Buy Workplace Safety & Incident Management Dashboard in Google Sheets
The Workplace Safety & Incident Management Dashboard in Google Sheets empowers organizations to proactively monitor safety metrics, manage incidents, and improve workplace conditions.
With its automated charts, intuitive interface, and customizable structure, it serves as a complete safety analytics solution for data-driven decision-making and compliance reporting.
Visit our YouTube channel to learn step-by-step video tutorials
Youtube.com/@NeotechNavigators
Watch the step-by-step video Demo:
Click to Buy Workplace Safety & Incident Management Dashboard in Google Sheets