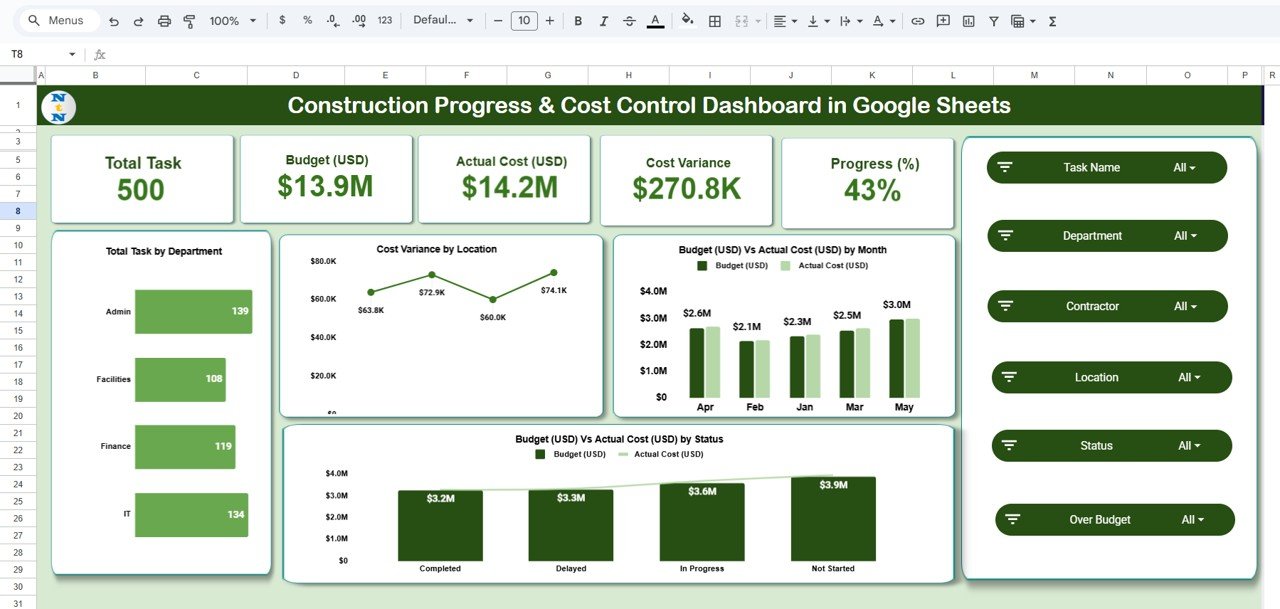
Managing multiple construction projects can be complex — tracking tasks, monitoring costs, and ensuring deadlines are met requires continuous visibility. The Construction Progress & Cost Control Dashboard in Google Sheets simplifies this process by providing a centralized platform to analyze project progress, cost performance, and contractor efficiency — all in real time.Construction Progress & Cost Control Dashboard in Google Sheets
This ready-to-use Google Sheets dashboard is ideal for construction managers, project engineers, and financial controllers looking to track actual vs. planned performance seamlessly.Construction Progress & Cost Control Dashboard in Google Sheets
What Is a Construction Progress & Cost Control Dashboard?
The Construction Progress & Cost Control Dashboard is a visual, data-driven tool that consolidates project information such as budgets, expenses, progress, and contractor performance.
By combining cost management and operational progress tracking, it helps teams:
-
Monitor overall project progress and expenditure.
-
Compare Actual vs. Budget values.
-
Identify delays and cost overruns early.
-
Evaluate department, contractor, and location-wise performance.
All insights are auto-generated from project data entered into the sheet.
Dashboard Structure
Click to Buy Construction Progress & Cost Control Dashboard in Google Sheets
The Google Sheets file contains the following key sheet tabs:
Overview Sheet Tab
The Overview Sheet provides the executive summary of the entire construction portfolio. It displays the main KPIs and comparative visuals for quick decision-making.
Cards Displayed:
-
Total Tasks: Number of total activities in the project pipeline.
-
Budget (USD): Total planned budget for the construction tasks.
-
Actual Cost (USD): Actual expenditure incurred to date.
-
Cost Variance (USD): Difference between budgeted and actual cost.
-
Progress (%): Overall project completion rate based on task progress.
Charts Included:
-
Total Tasks by Department
-
Cost Variance by Location
-
Budget (USD) vs. Actual Cost (USD) by Month
-
Budget (USD) vs. Actual Cost (USD) by Status
Click to Buy Construction Progress & Cost Control Dashboard in Google Sheets
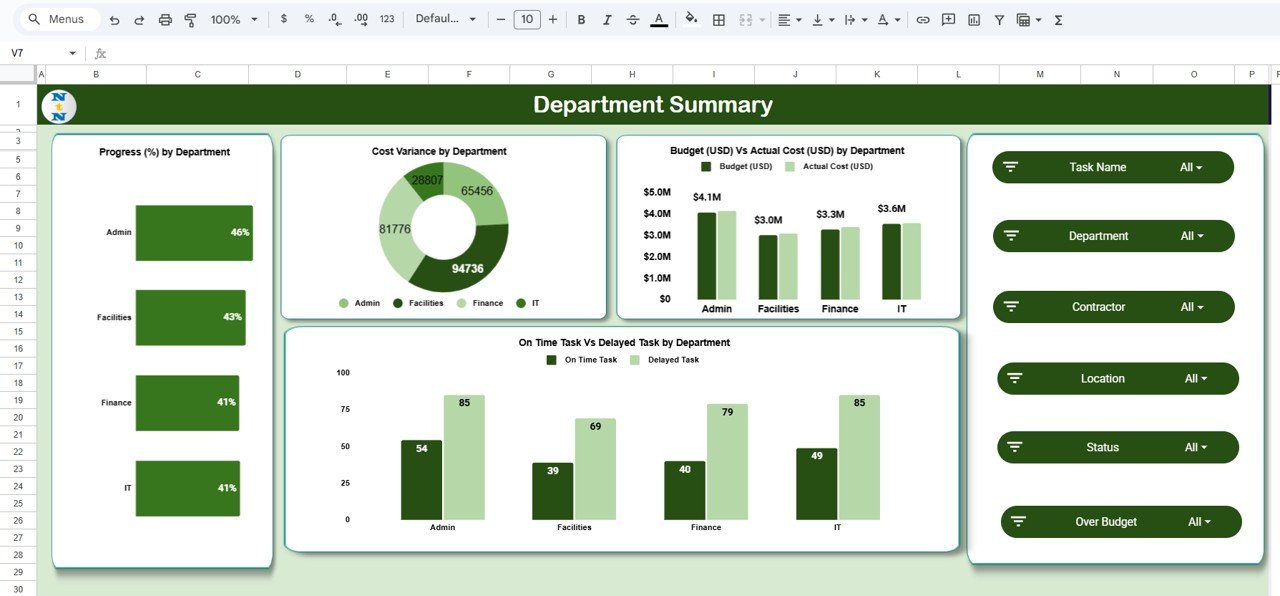
Department Summary Tab
This section provides insights into performance at the department level, helping management understand which teams are performing efficiently.
Charts Included:
-
Progress (%) by Department
-
Cost Variance by Department
-
Budget (USD) vs. Actual Cost (USD) by Department
-
On-Time Task vs. Delayed Task by Department
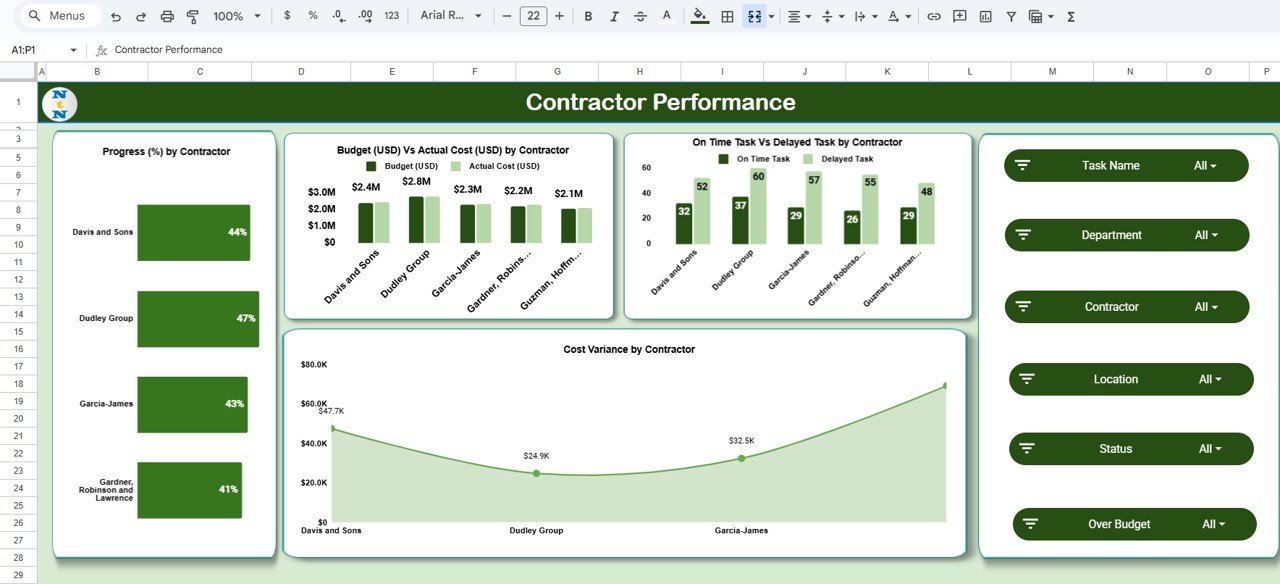
Contractor Performance Tab
Monitors the effectiveness and financial performance of contractors.
Charts Included:
-
Progress (%) by Contractor
-
Budget (USD) vs. Actual Cost (USD) by Contractor
-
On-Time Task vs. Delayed Task by Contractor
-
Cost Variance by Contractor
This helps identify reliable contractors and address inefficiencies early.
Click to Buy Construction Progress & Cost Control Dashboard in Google Sheets
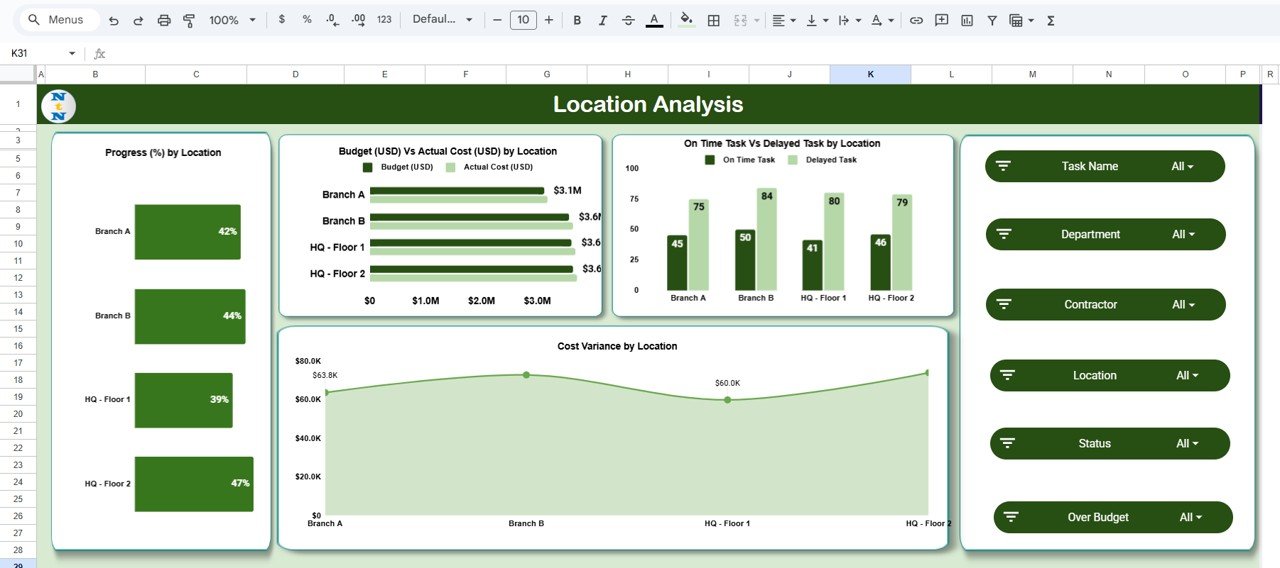
Location Analysis Tab
Evaluates project execution by region or site to ensure timely delivery and cost control across all project locations.
Charts Included:
-
Progress (%) by Location
-
Budget (USD) vs. Actual Cost (USD) by Location
-
On-Time Task vs. Delayed Task by Location
-
Cost Variance by Location
Click to Buy Construction Progress & Cost Control Dashboard in Google Sheets
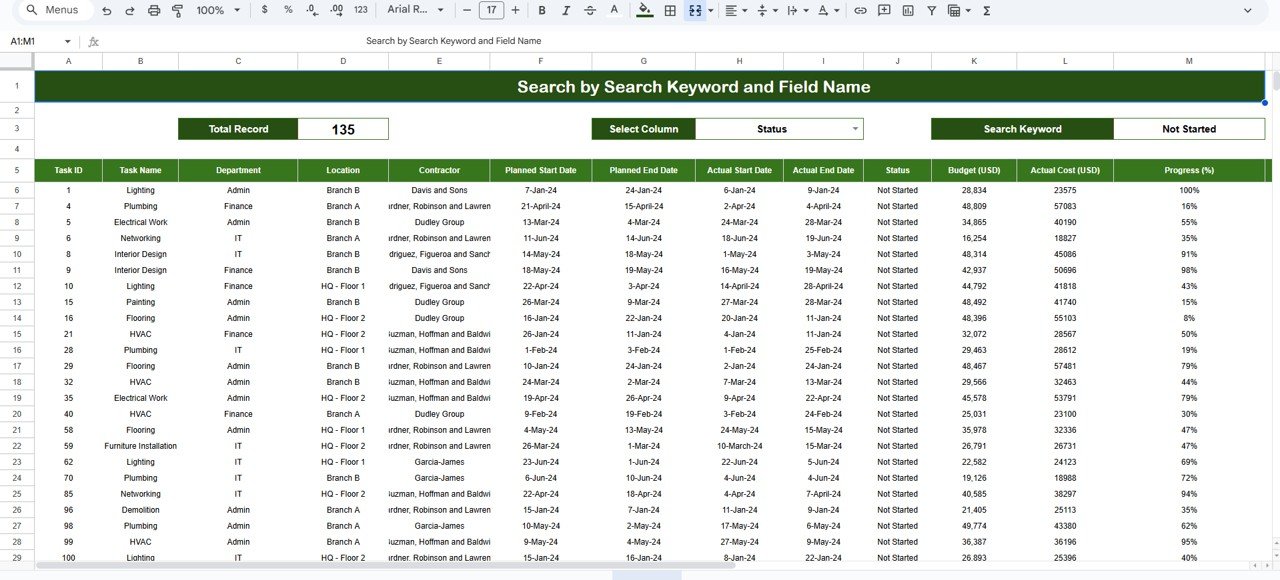
Search Sheet Tab
A Smart Search functionality allows users to locate specific project records instantly.
Search Options:
-
Search by Keyword (e.g., “HVAC” or “Electrical Work”)
-
Search by Field Name (e.g., Department, Contractor, or Location)
Example:
-
Entering “Foundation” shows all tasks related to foundation work.
-
Entering “Contractor A” shows progress and cost details for that contractor.
Data Sheet Tab
This is the data entry and source sheet where project records are stored.

Click to Buy Construction Progress & Cost Control Dashboard in Google Sheets
Advantages
-
🧱 Centralized Construction Monitoring: Tracks all project progress and costs in one visual sheet.
-
💰 Cost Control Automation: Detects overspending and underperforming contractors early.
-
📊 Comprehensive Analysis: Provides insights by department, contractor, and location.
-
⚙️ Fully Editable: Modify parameters and visuals easily in Google Sheets.
-
☁️ Cloud Collaboration: Teams can input and view live updates simultaneously.
Opportunities for Improvement
Click to Buy Construction Progress & Cost Control Dashboard in Google Sheets
-
Integrate Google Forms for task updates from site engineers.
-
Add forecasting logic for cost-to-complete analysis.
-
Include timeline Gantt charts to visualize delays.
-
Automate email alerts for over-budget tasks via Apps Script.
-
Add slicer filters for Month, Department, or Contractor in the dashboard.
Best Practices
-
Update actual cost and progress weekly for real-time insights.
-
Track cost variance = Budget − Actual Cost to control overspending.
-
Maintain consistent naming conventions for tasks and contractors.
-
Review contractor performance monthly to optimize outsourcing.
-
Store historical data annually for year-over-year analysis.
Conclusion
Click to Buy Construction Progress & Cost Control Dashboard in Google Sheets
The Construction Progress & Cost Control Dashboard in Google Sheets enables project leaders to stay on top of deadlines, budgets, and performance — all in one view.
Whether managing a single building project or a large multi-site development, this dashboard provides the actionable intelligence needed to improve productivity, minimize delays, and maintain cost discipline.
Visit our YouTube channel to learn step-by-step video tutorials
Youtube.com/@NeotechNavigators
Watch the step-by-step video Demo:
Click to Buy Construction Progress & Cost Control Dashboard in Google Sheets