Managing commercial leases requires continuous monitoring of rent values, lease expiry dates, property utilization, risk levels, and renewal timelines. When organizations handle multiple properties, locations, and lease types, tracking all this information manually becomes difficult and error-prone.Commercial Lease Analytics Dashboard in Google Sheets
The Commercial Lease Analytics Dashboard in Google Sheets is a ready-to-use tool designed to simplify lease management by providing a clear and organized overview of financials, lease status, property utilization, and upcoming renewals.Commercial Lease Analytics Dashboard in Google Sheets
In this article, we explain the dashboard structure, its features, and how it helps real estate teams, facility teams, and finance departments manage leases more efficiently.Commercial Lease Analytics Dashboard in Google Sheets
What Is the Commercial Lease Analytics Dashboard in Google Sheets?
Click to Buy Commercial Lease Analytics Dashboard in Google Sheets
This Google Sheets dashboard centralizes all commercial lease information and turns complex lease data into meaningful insights. It helps businesses:
-
Track total leases and monthly rent
-
Monitor lease expiry and renewal opportunities
-
Analyze maintenance and property costs
-
Understand space utilization
-
Identify high-risk leases
-
Review lease performance by property and location
The dashboard updates automatically when new lease data is added to the Data sheet.
Why Use Google Sheets for Lease Analytics?
Google Sheets is ideal because it offers:
-
Real-time updates
-
Easy data sharing across finance, facility, and admin teams
-
No additional software cost
-
Customizable fields and formulas
-
Built-in charts for fast analysis
It is perfect for both small real estate portfolios and large multi-location organizations.
Dashboard Structure and Features
Click to Buy Commercial Lease Analytics Dashboard in Google Sheets
The Commercial Lease Analytics Dashboard contains multiple sections with charts and KPI cards for easy analysis.
1. Overview Sheet Tab
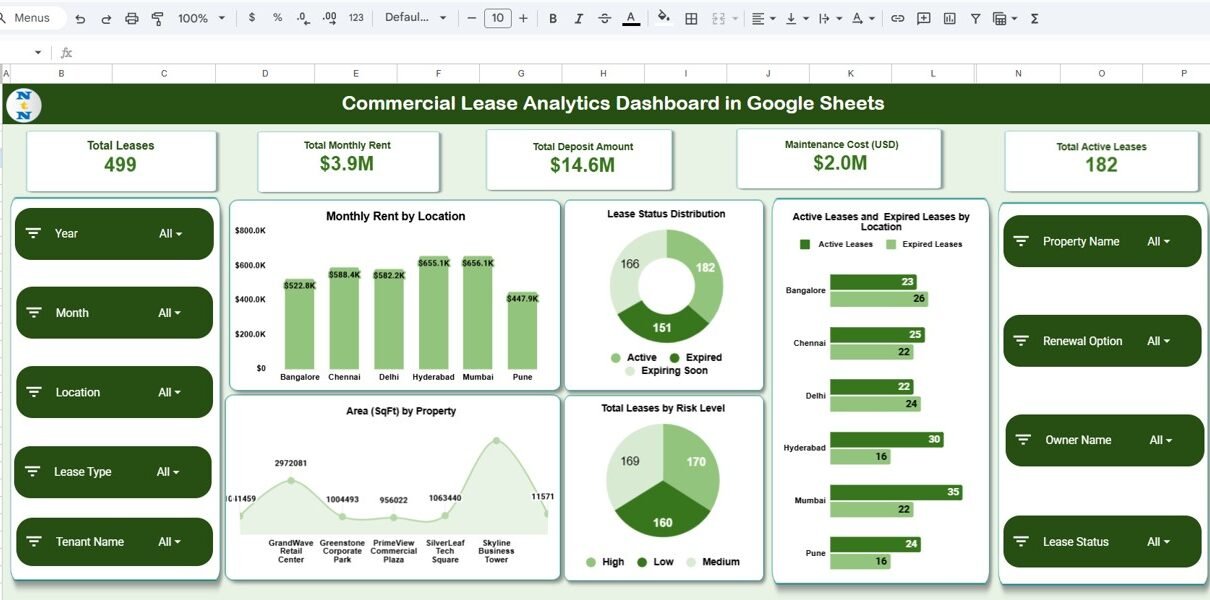
This is the main dashboard where key lease metrics are displayed.
Card Metrics Include:
-
Total Leases – Overall number of commercial leases
-
Total Monthly Rent – Total rent expense per month
-
Total Deposit Amount – Combined security deposit amount
-
Maintenance Cost (USD) – Total maintenance costs
-
Total Active Leases – Number of currently active leases
Charts Included:
-
Monthly Rent by Location
Shows rent expense distribution across geographic locations. -
Lease Status Distribution
Displays Active, Expired, Pending, and Under Review leases. -
Active vs Expired Leases by Location
Helps identify locations with expiring lease risks. -
Total Leases by Risk Level
Shows lease categorization based on risk: High, Medium, Low. -
Area (SqFt) by Property
Helps identify properties with maximum leased space.

Click to Buy Commercial Lease Analytics Dashboard in Google Sheets
2. Lease Expiry & Renewal Analysis
This section highlights time-sensitive and renewal-related insights.
Charts Include:
-
Expiring Soon by Location
Displays leases that require immediate action. -
Expired Leases by Lease Type
Helps compare expiries among commercial, retail, warehouse, etc. -
Expiring Soon by Renewal Option
Shows which leases can be renewed vs. renegotiated. -
Expiring Soon by Property
Helps property managers focus on urgent renewals.

3. Financial Analysis
This sheet provides financial insights on rents, deposits, and maintenance.
Charts Include:
-
Maintenance Cost (USD) by Location
Shows cost distribution and helps identify expensive locations. -
Monthly Rent (USD) by Lease Type
Helps compare rent trends across office, retail, warehouse, etc. -
Monthly Rent vs. Deposit Amount by Property
Helps analyze rent-to-deposit ratio.
This section supports budgeting decisions and cost optimization.

Click to Buy Commercial Lease Analytics Dashboard in Google Sheets
4. Space & Utilization Analysis
Space metrics help organizations understand total leased area and usage.
Charts Include:
-
Area (SqFt) by Location
-
Area (SqFt) by Lease Type
-
Area (SqFt) by Property
These charts help compare property utilization patterns and plan future space requirements.

5. Search Sheet Tab
This feature allows users to search lease records instantly by:
-
Keyword
-
Field Name (Property, Lease Type, Location, Date, Status, etc.)
This makes data retrieval quick and effortless.

Click to Buy Commercial Lease Analytics Dashboard in Google Sheets
6. Data Sheet
The Data sheet holds all lease details, including:
-
Lease ID
- Property Name
- Location
- Lease Start Date
- Lease End Date
- Monthly Rent
- Deposit Amount
- Maintenance Cost
- Lease Type
- Area (SqFt)
- Renewal Option
- Risk Level
- Status
- Owner / Manager
All dashboard visuals are powered by this dataset.

Click to Buy Commercial Lease Analytics Dashboard in Google Sheets
Advantages of the Commercial Lease Analytics Dashboard
-
Centralized Lease Management
All lease details in one place for easy access. -
Quick Identification of Expiring Leases
Helps prevent unexpected closures or penalties. -
Improved Financial Planning
Rent, deposit, and maintenance cost insights support budgeting. -
Better Space Utilization Decisions
Helps companies understand property usage across locations. -
Risk Management
Highlights leases categorized as high or medium risk. -
Customizable and Cloud-Based
Works anywhere and adapts to your lease data structure. -
Real-Time Visualization
Charts update automatically as data changes.
Opportunities for Improvement
You can further improve this dashboard by adding:
-
Automated lease renewal reminders
-
Vendor/landlord contact database integration
-
Gantt chart for lease timelines
-
Forecasting model for lease expenses
-
Google Forms integration for lease update requests
-
Document attachment links (contracts, agreements)
Best Practices
Click to Buy Commercial Lease Analytics Dashboard in Google Sheets
-
Update lease data regularly
-
Use consistent lease terminology
-
Review expiring leases monthly
-
Track maintenance cost changes
-
Monitor rent escalations or renegotiations
-
Share dashboard with finance and facility teams
Conclusion
The Commercial Lease Analytics Dashboard in Google Sheets provides a complete and professional way to analyze lease performance, manage expiring leases, track rent and maintenance costs, and understand space utilization. With automated charts, KPI cards, and search functionality, it helps organizations make smarter lease decisions and avoid costly surprises.Commercial Lease Analytics Dashboard in Google Sheets
Whether you manage 5 leases or 500, this dashboard ensures full control and visibility over your commercial real estate portfolio.Commercial Lease Analytics Dashboard in Google Sheets
Frequently Asked Questions (FAQs)
Click to Buy Commercial Lease Analytics Dashboard in Google Sheets
1. What does this dashboard track?
It tracks rent, deposit, maintenance cost, lease expiry, renewal options, property area, and lease status.
2. Can I customize the fields?
Yes, all fields in the Data sheet can be customized.
3. Does the dashboard identify high-risk leases?
Yes, the risk level chart highlights High, Medium, and Low-risk leases.
4. Is there a renewal analysis feature?
Yes, the Lease Expiry & Renewal section provides detailed insights.
5. Can multiple users collaborate?
Yes, Google Sheets supports multi-user editing.
Visit our YouTube channel to learn step-by-step video tutorials
Youtube.com/@NeotechNavigators
Watch the step-by-step video Demo:
Click to Buy Commercial Lease Analytics Dashboard in Google Sheets