Retail businesses operate on tight margins. Prices fluctuate. Costs increase. Customer behavior changes quickly. Therefore, retailers must monitor profit margins continuously to stay competitive and profitable. However, many teams still rely on scattered spreadsheets or delayed reports, which makes margin analysis slow and unreliable.
That is exactly why a Retail Profit Margin KPI Dashboard in Google Sheets becomes a powerful decision-making tool.
This ready-to-use dashboard helps retailers track profit margins, compare performance against targets, analyze trends, and identify improvement areas using clear KPIs and visual indicators. Moreover, it supports MTD (Month-to-Date) and YTD (Year-to-Date) tracking with previous year comparisons, enabling smarter pricing and cost decisions.
In this article, you will learn how the dashboard works, which KPIs it tracks, its advantages, opportunities for improvement, best practices, and frequently asked questions.
What Is a Retail Profit Margin KPI Dashboard in Google Sheets?
A Retail Profit Margin KPI Dashboard in Google Sheets is an interactive reporting tool designed to measure and monitor profitability across retail operations.
Instead of manually calculating margins every month, this dashboard:
- Centralizes all profit-related KPIs
- Tracks margins at MTD and YTD levels
- Compares Actual vs Target performance
- Shows Previous Year comparisons
- Highlights trends using visual indicators
Because it runs in Google Sheets, teams can collaborate in real time and update data easily without complex tools.
Why Is Profit Margin Tracking Critical for Retail Businesses?
Click to Buy Retail Profit Margin KPI Dashboard in Google Sheets
Profit margin directly reflects the financial health of a retail business. Therefore, accurate tracking helps retailers:
- Control costs effectively
- Optimize pricing strategies
- Improve supplier negotiations
- Identify low-margin products early
- Increase overall profitability
As a result, profit margin KPIs support both short-term actions and long-term strategy.
Key Features of the Retail Profit Margin KPI Dashboard
This dashboard follows a structured and scalable design that suits both small retailers and large chains.
Key Highlights
- Month selector for instant KPI updates
- MTD and YTD performance tracking
- Target vs Actual margin analysis
- Previous Year comparisons
- Conditional formatting with up/down arrows
- Dedicated KPI trend analysis
- Separate data entry and definition sheets
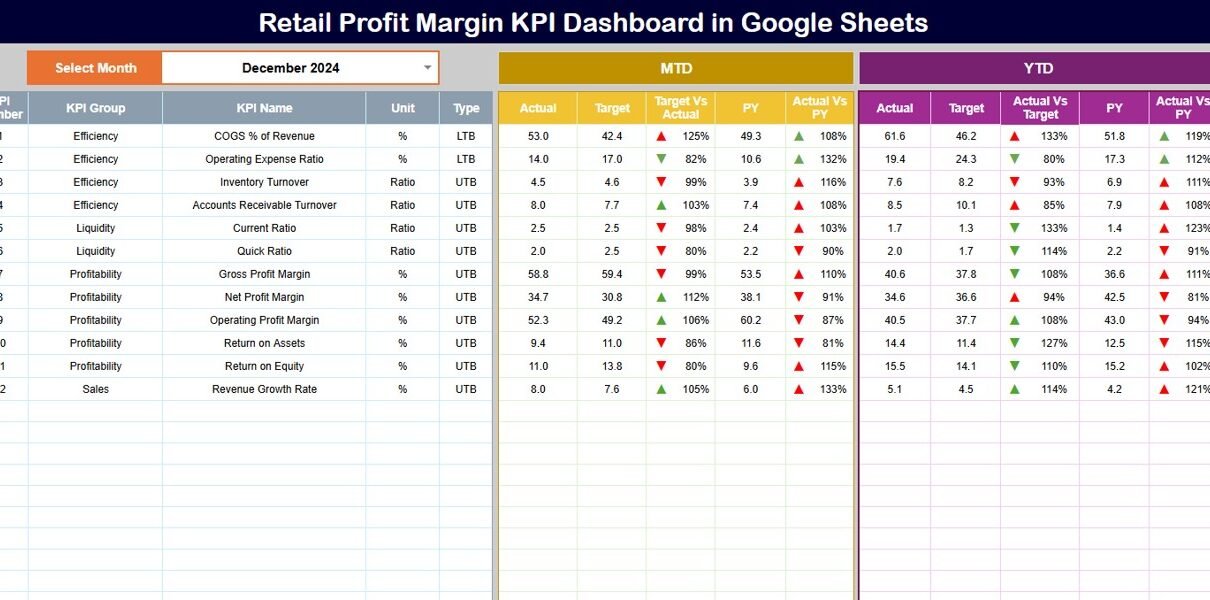
Dashboard Sheet Tab – Main Performance View
The Dashboard Sheet acts as the executive summary of retail profit performance.
Month Selection
-
Select the month from Cell D3
-
All KPIs update automatically for that month
MTD Profit Margin KPIs
For each KPI, the dashboard displays:
-
MTD Actual
-
MTD Target
-
MTD Previous Year
-
Target vs Actual (%)
-
PY vs Actual (%)
Directional arrows clearly indicate improvement or decline.
YTD Profit Margin KPIs
The dashboard also shows:
-
YTD Actual
-
YTD Target
-
YTD Previous Year
-
Target vs Actual (%)
-
PY vs Actual (%)
This view helps retailers understand long-term margin trends.

Click to Buy Retail Profit Margin KPI Dashboard in Google Sheets
KPI Trend Sheet Tab – KPI Deep Dive
The KPI Trend Sheet provides detailed insight into individual KPIs.
How It Works
-
Select a KPI name from the dropdown in Cell C3
-
The sheet dynamically displays related details
Displayed KPI Information
- KPI Group
- KPI Unit
- KPI Type (Lower the Better / Upper the Better)
- KPI Formula
- KPI Definition
This sheet ensures complete clarity and transparency for every KPI.

Click to Buy Retail Profit Margin KPI Dashboard in Google Sheets
Actual Number Sheet Tab
This sheet stores actual performance data.
Usage Instructions
-
Enter the first month of the year in Cell E1
-
Input MTD Actual and YTD Actual values
-
Dashboard updates automatically
This structured approach ensures consistent and accurate reporting.

Target Sheet Tab
The Target Sheet defines performance benchmarks.
What to Enter
-
Monthly MTD Target values
-
Cumulative YTD Target values
Targets help retailers evaluate performance objectively.

Click to Buy Retail Profit Margin KPI Dashboard in Google Sheets
Previous Year Number Sheet Tab
Historical comparison plays a key role in margin analysis.
Purpose
-
Enter previous year MTD and YTD values
-
Compare current performance with last year
-
Identify recurring margin issues

Click to Buy Retail Profit Margin KPI Dashboard in Google Sheets
KPI Definition Sheet Tab – KPI Master List
This sheet acts as the central KPI reference.
Fields Included
- KPI Name
- KPI Group
- Unit
- Formula
- KPI Definition
- KPI Type

Click to Buy Retail Profit Margin KPI Dashboard in Google Sheets
Advantages of Using the Retail Profit Margin KPI Dashboard
- Centralized profitability tracking
- Faster margin analysis
- Better pricing decisions
- Improved cost control
- Clear performance comparisons
- Easy collaboration in Google Sheets
- No expensive BI tools required
Opportunities for Improvement
Retailers can enhance this dashboard by:
-
Adding category-wise margin analysis
-
Tracking store-level profitability
-
Integrating supplier cost trends
-
Linking promotions with margin impact
-
Automating data capture from POS systems
Best Practices for Using the Retail Profit Margin Dashboard
Click to Buy Retail Profit Margin KPI Dashboard in Google Sheets
-
Update sales and cost data regularly
-
Review margins monthly and quarterly
-
Compare Actual vs Target consistently
-
Monitor discount and return impact closely
-
Share insights with merchandising and pricing teams
-
Use trends to refine retail strategy
Conclusion
A Retail Profit Margin KPI Dashboard in Google Sheets gives retailers complete visibility into profitability drivers. It transforms raw financial data into actionable insights that support smarter pricing, cost control, and long-term growth.
Because the dashboard is simple, flexible, and scalable, it becomes an essential tool for any retail business focused on sustained profitability.
Frequently Asked Questions (FAQs)
Click to Buy Retail Profit Margin KPI Dashboard in Google Sheets
1. Who should use this dashboard?
Retail owners, finance teams, store managers, and category managers.
2. Can KPIs be customized?
Yes, all KPIs, formulas, and targets are fully customizable.
3. Does the dashboard support MTD and YTD tracking?
Yes, it tracks both with historical comparisons.
4. Is Google Sheets secure for financial data?
Yes, with proper access and sharing controls.
5. Can this dashboard scale for multi-store retail chains?
Yes, it works for single stores and large retail networks.
Visit our YouTube channel to learn step-by-step video tutorials
Youtube.com/@NeotechNavigators
Click to Buy Retail Profit Margin KPI Dashboard in Google Sheets