Mobile apps succeed or fail based on user engagement. Downloads alone never define success. Instead, organizations must understand how users interact with the app, how often they return, how long they stay, and what actions they perform. Because engagement data often lives across multiple analytics tools, teams struggle to see a complete picture.Mobile App Engagement KPI Dashboard in Google Sheets
This challenge makes a Mobile App Engagement KPI Dashboard in Google Sheets extremely valuable.
This ready-to-use dashboard centralizes all engagement KPIs in one structured Google Sheets file. It allows product managers, growth teams, marketers, and leadership to track performance using Month-to-Date (MTD), Year-to-Date (YTD), target comparisons, and trend analysis.
In this article, we will explain how the dashboard works, its worksheet structure, the complete KPI list with formulas, and best practices for using it effectively.Mobile App Engagement KPI Dashboard in Google Sheets
What Is a Mobile App Engagement KPI Dashboard in Google Sheets?
Click to Buy Mobile App Engagement KPI Dashboard in Google Sheets
A Mobile App Engagement KPI Dashboard is a performance monitoring system that tracks how users interact with a mobile application. It measures activity, retention, usage behavior, and engagement quality using clearly defined KPIs.
Because this dashboard is built in Google Sheets, it offers:
-
Easy collaboration
-
Real-time updates
-
No licensing cost
-
Simple customization
-
Clear KPI transparency
Instead of switching between analytics platforms, teams get one consistent performance view.
Key Features of the Mobile App Engagement KPI Dashboard
The dashboard contains 6 structured worksheet tabs, each designed to support accurate KPI tracking and analysis.Mobile App Engagement KPI Dashboard in Google Sheets
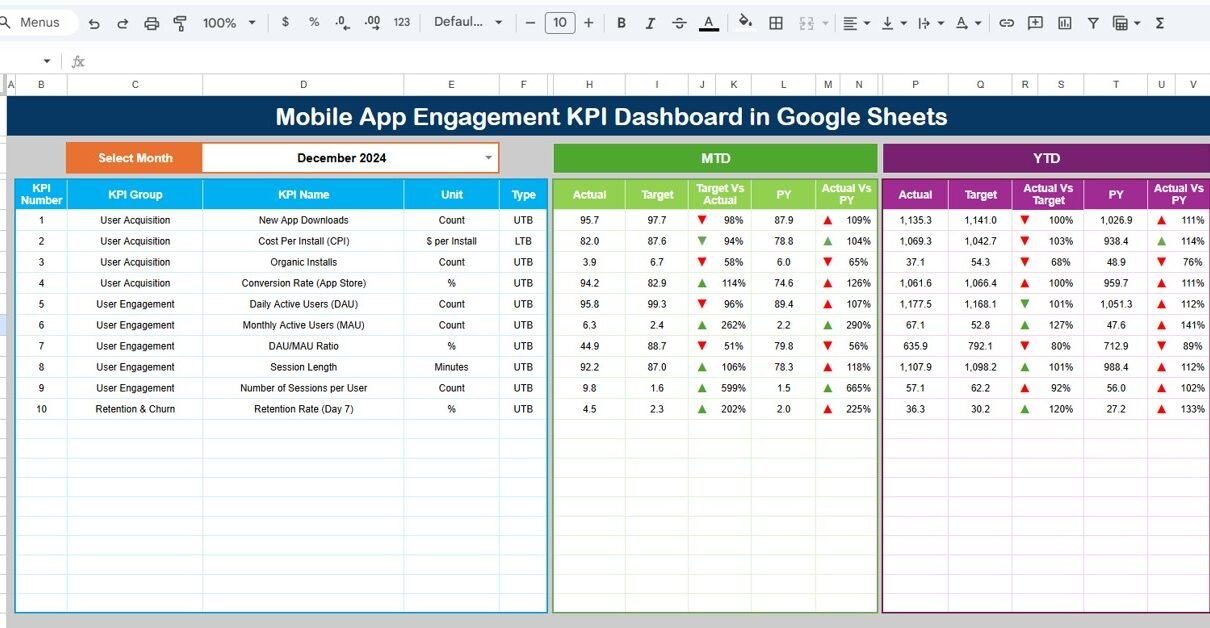
Dashboard Sheet Tab (Main Dashboard)
Click to Buy Mobile App Engagement KPI Dashboard in Google Sheets
This is the main dashboard view used for reviews and reporting.
-
On cell D3, you select the month from a dropdown
-
Once selected, the entire dashboard updates automatically
Metrics displayed on this sheet:
MTD (Month-to-Date)
-
Actual
-
Target
-
Previous Year
-
Target vs Actual
-
Previous Year vs Actual
YTD (Year-to-Date)
-
Actual
-
Target
-
Previous Year
-
Target vs Actual
-
Previous Year vs Actual
Conditional formatting with up and down arrows clearly shows performance trends:
-
⬆ Green arrow = improvement
-
⬇ Red arrow = decline
This sheet gives leadership instant visibility into engagement performance.

Click to Buy Mobile App Engagement KPI Dashboard in Google Sheets
KPI Trend Sheet Tab
The KPI Trend Sheet focuses on individual KPI analysis.
-
Select a KPI name from the dropdown in cell C3
The sheet displays:
-
KPI Group
-
KPI Unit
-
KPI Type (Lower the Better / Upper the Better)
-
KPI Formula
-
KPI Definition
You also see month-wise trends, which help teams understand engagement movement over time.

Click to Buy Mobile App Engagement KPI Dashboard in Google Sheets
Actual Number Sheet Tab
This sheet stores actual engagement values.
-
Select the first month of the year in cell E1
-
Enter MTD and YTD actual values for each KPI
All calculations and dashboard visuals update automatically.

Click to Buy Mobile App Engagement KPI Dashboard in Google Sheets
Target Sheet Tab
This sheet stores target values for each KPI.
-
MTD Target
-
YTD Target
Targets help teams:
-
Measure growth goals
-
Track progress objectively
-
Align engagement metrics with business strategy

Click to Buy Mobile App Engagement KPI Dashboard in Google Sheets
Previous Year Number Sheet Tab
This sheet captures previous year engagement data.
It supports:
-
Year-over-Year comparison
-
Trend benchmarking
-
Performance improvement analysis

KPI Definition Sheet Tab
This sheet acts as the reference foundation of the dashboard.
It includes:
-
KPI Name
-
KPI Group
-
Unit
-
Formula
-
KPI Definition
-
KPI Type (UTB / LTB)
This ensures clarity, consistency, and transparency.

Click to Buy Mobile App Engagement KPI Dashboard in Google Sheets
Advantages of Mobile App Engagement KPI Dashboard
-
Centralized engagement tracking
-
Clear MTD and YTD visibility
-
Target and benchmark comparison
-
Faster decision-making
-
Improved product strategy
-
No dependency on complex BI tools
-
Easy collaboration
Opportunities for Improvement in Engagement Tracking
Click to Buy Mobile App Engagement KPI Dashboard in Google Sheets
-
Integrate Firebase or App Analytics data
-
Add cohort analysis
-
Track funnel drop-off rates
-
Introduce predictive churn scoring
-
Add A/B test performance KPIs
-
Automate data imports
Best Practices for Using the Dashboard
-
Define KPIs clearly before tracking
-
Update data regularly
-
Review trends weekly, not just monthly
-
Focus on retention before acquisition
-
Set realistic engagement targets
-
Use KPI trends during product planning
Conclusion
Click to Buy Mobile App Engagement KPI Dashboard in Google Sheets
A Mobile App Engagement KPI Dashboard in Google Sheets gives organizations a clear and actionable view of how users interact with their app. It combines engagement, retention, performance, and monetization metrics into one structured dashboard. Because it supports MTD, YTD, target, and historical comparisons, teams gain confidence in every product decision.Mobile App Engagement KPI Dashboard in Google Sheets
For mobile-first businesses, this dashboard becomes an essential engagement management tool.Mobile App Engagement KPI Dashboard in Google Sheets
Frequently Asked Questions (FAQs)
Click to Buy Mobile App Engagement KPI Dashboard in Google Sheets
1. Who should use this dashboard?
Product managers, growth teams, marketers, and leadership.
2. Can KPIs be customized?
Yes, all KPIs are fully editable.
3. Does it support multiple apps?
Yes, with minor customization.
4. Can it replace mobile analytics tools?
It complements analytics tools and simplifies reporting.
5. Is Google Sheets secure for app data?
Yes, with proper access controls.
6. Do I need technical skills to use it?
No, basic Google Sheets knowledge is enough.
Visit our YouTube channel to learn step-by-step video tutorials
Youtube.com/@NeotechNavigators
Watch the step-by-step video tutorial:
Click to Buy Mobile App Engagement KPI Dashboard in Google Sheets