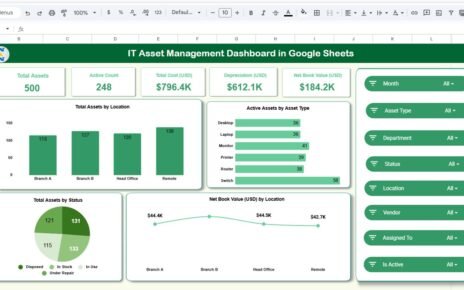
Managing an office vehicle fleet involves tracking multiple cost drivers such as vehicle purchases, fuel expenses, insurance, maintenance, utilization, and downtime. However, when this information is scattered across spreadsheets or manual reports, fleet management becomes inefficient and error-prone.Office Vehicle Fleet Dashboard in Google Sheets
That is exactly why the Office Vehicle Fleet Dashboard in Google Sheets is a powerful, ready-to-use solution. This dashboard transforms raw fleet data into clear KPIs, interactive visuals, and actionable insights—helping organizations control costs, improve utilization, and make data-driven decisions without complex tools.Office Vehicle Fleet Dashboard in Google Sheets
What Is an Office Vehicle Fleet Dashboard in Google Sheets?
An Office Vehicle Fleet Dashboard in Google Sheets is a centralized reporting and analytics template designed to monitor all key fleet-related metrics in one place. Using Google Sheets’ built-in charts, slicers, and formulas, this dashboard allows fleet managers to analyze performance by department, region, vendor, fuel type, and time period.Office Vehicle Fleet Dashboard in Google Sheets
Because it is built in Google Sheets, it is cloud-based, collaborative, and easy to maintain—making it ideal for small to large organizations.
Key Features of the Office Vehicle Fleet Dashboard
Click to Buy Office Vehicle Fleet Dashboard in Google Sheets
This dashboard is fully interactive and designed for real-world fleet operations.
Interactive Filters
Use slicers to filter data by:
- Vehicle Type
- Fuel Type
- Department
- Region
- Vendor
All charts and KPIs update instantly based on selections.
KPI Cards
Quickly view high-level performance metrics such as:
- Total Vehicles
- Purchase Cost (USD)
- Annual Maintenance Cost (USD)
- Annual Insurance Cost (USD)
- Total Operating Cost (USD)
Multi-Level Analysis
Analyze fleet data across:
- Departments
- Regions
- Vendors
- Fuel Types
- Monthly trends
🔍 Search Functionality
Search records dynamically by Search Keyword and Field Name, making it easy to locate specific vehicles or departments.
Dashboard Structure & Sheet-Wise Explanation
Click to Buy Office Vehicle Fleet Dashboard in Google Sheets
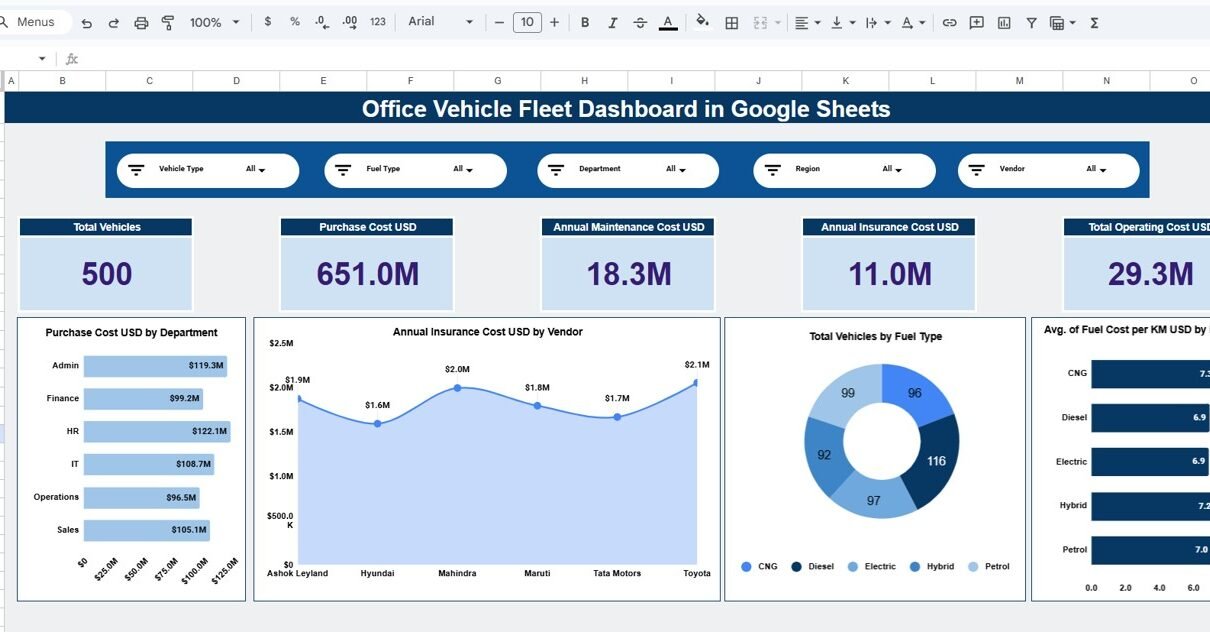
1️⃣ Overview Sheet
The Overview sheet provides a snapshot of overall fleet performance.
Cards
-
Total Vehicles
-
Purchase Cost USD
-
Annual Maintenance Cost USD
-
Annual Insurance Cost USD
-
Total Operating Cost USD
Charts
-
Purchase Cost USD by Department
-
Annual Insurance Cost USD by Vendor
-
Total Vehicles by Fuel Type
-
Average Fuel Cost per KM by Fuel Type
This page is ideal for leadership-level monitoring.

Click to Buy Office Vehicle Fleet Dashboard in Google Sheets
2️⃣ Department Analysis
The Department Analysis sheet focuses on how fleet resources are used across departments.
Charts
-
Purchase Cost USD by Department
-
Annual Insurance Cost USD by Department
-
Total Vehicles by Department
-
Operating Cost USD by Department
-
Average Fuel Cost per KM by Department
This analysis helps identify cost-heavy departments and optimize vehicle allocation.

3️⃣ Region Analysis
The Region Analysis sheet highlights geographic performance.
Charts
-
Purchase Cost USD by Region
-
Annual Insurance Cost USD by Region
-
Total Vehicles by Region
-
Operating Cost USD by Region
-
Average Fuel Cost per KM by Region
It enables comparison of regional efficiency and cost control.

Click to Buy Office Vehicle Fleet Dashboard in Google Sheets
4️⃣ Vendor Analysis
The Vendor Analysis sheet evaluates supplier performance.
Charts
-
Purchase Cost USD by Vendor
-
Annual Insurance Cost USD by Vendor
-
Total Vehicles by Vendor
-
Operating Cost USD by Vendor
-
Average Fuel Cost per KM by Vendor
This helps in vendor negotiations and procurement strategy optimization.

5️⃣ Monthly Trends
The Monthly Trends sheet tracks performance over time.
Charts
-
Purchase Cost USD by Month
-
Annual Insurance Cost USD by Month
-
Operating Cost USD by Month
-
Average Fuel Cost per KM by Month
This page is useful for identifying seasonal patterns and cost fluctuations.

Click to Buy Office Vehicle Fleet Dashboard in Google Sheets
6️⃣ Data & Search Sheet
This sheet contains detailed vehicle-level data, including:
- Vehicle ID
- Vehicle Type & Fuel Type
- Department & Region
- Vendor
- Purchase Date & Purchase Cost
- Total KM Run & Mileage
- Fuel Cost per KM
- Maintenance & Insurance Costs
- Downtime Days & Vehicle Status
A Search by Search Keyword and Field Name feature allows quick filtering and record lookup.

Click to Buy Office Vehicle Fleet Dashboard in Google Sheets
Advantages of Using an Office Vehicle Fleet Dashboard
-
Centralized fleet data in one dashboard
-
Improved cost visibility and control
-
Faster decision-making with real-time insights
-
Easy collaboration using Google Sheets
-
No coding or advanced BI tools required
Opportunities for Improvement
-
Integrate GPS or telematics data for real-time tracking
-
Add CO₂ emissions KPIs for sustainability reporting
-
Automate data input using Google Forms or APIs
-
Add alert logic for high fuel or maintenance costs
Best Practices for Using This Dashboard
Click to Buy Office Vehicle Fleet Dashboard in Google Sheets
-
Keep data updated regularly
-
Use standardized vehicle and vendor naming
-
Review monthly trends consistently
-
Combine dashboard insights with policy decisions
-
Limit edit access to maintain data integrity
Who Can Use This Dashboard?
This dashboard is ideal for:
-
Fleet Managers
-
Operations Teams
-
Finance & Admin Departments
-
Facility Management Teams
-
Corporate Procurement Teams
Final Thoughts
Click to Buy Office Vehicle Fleet Dashboard in Google Sheets
The Office Vehicle Fleet Dashboard in Google Sheets is a practical, scalable, and highly effective solution for managing organizational vehicle fleets. By consolidating costs, utilization, and performance metrics into one interactive dashboard, organizations can reduce expenses, improve efficiency, and gain complete control over fleet operations.
Visit our YouTube channel to learn step-by-step video tutorials
Youtube.com/@NeotechNavigators
Watch the step-by-step video tutorial:
Click to Buy Office Vehicle Fleet Dashboard in Google Sheets