The wearable technology market is growing rapidly, driven by innovation, customer demand, and constant product evolution. To stay competitive, organizations need clear visibility into performance across sales, operations, quality, and customer engagement. That is exactly where the Wearable Tech KPI Dashboard in Google Sheets becomes an essential tool.
This ready-to-use KPI dashboard helps you track, analyze, and improve wearable technology performance using structured KPIs, automated calculations, and interactive visuals—all within Google Sheets.
What Is the Wearable Tech KPI Dashboard in Google Sheets?
Click to Buy Wearable Tech KPI Dashboard in Google Sheets
The Wearable Tech KPI Dashboard in Google Sheets is a professionally designed performance management template that tracks all critical KPIs related to wearable technology products and operations.
Each KPI is supported with:
-
Unit of measurement
-
Aggregation logic
-
KPI definition
-
Performance direction (Lower the Better / Upper the Better)
With a dynamic month selector, the dashboard instantly updates KPIs, visuals, and indicators, making it ideal for both operational tracking and executive reporting.
Key Highlights of the Dashboard
-
Centralized view of all wearable tech KPIs
-
Dynamic MTD and YTD performance tracking
-
Traffic-light indicators and trend arrows
-
KPI trend analysis with definitions and formulas
-
Fully built in Google Sheets (no add-ons required)
Dashboard Structure & Worksheets
The Wearable Tech KPI Dashboard in Google Sheets is built with 6 structured worksheets, each designed for a specific analytical purpose.
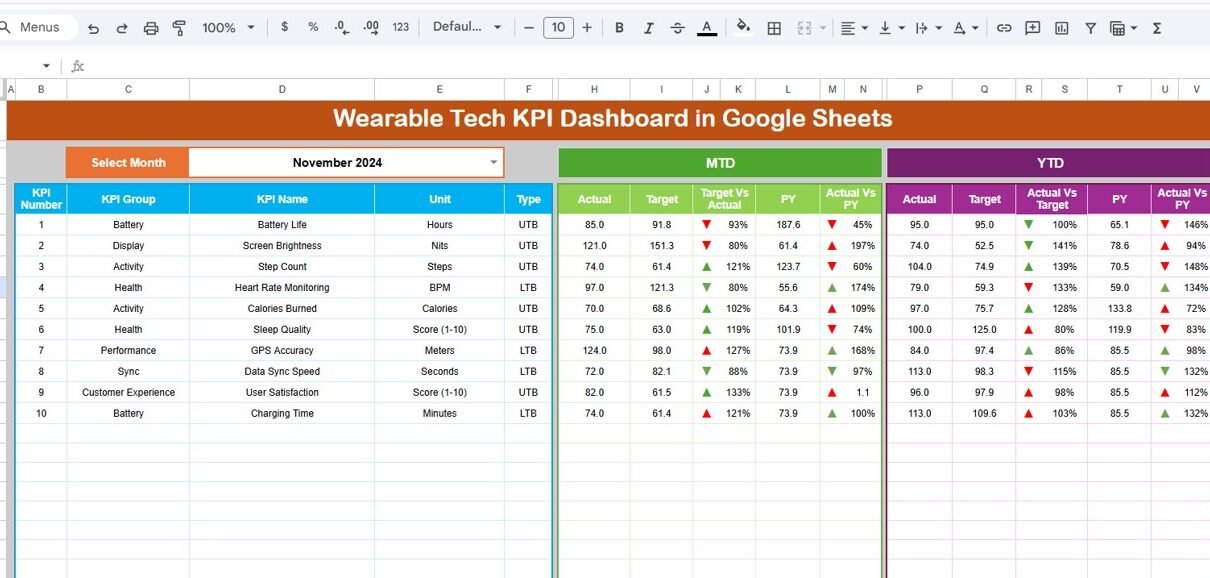
Dashboard Sheet Tab (Main Dashboard)
Click to Buy Wearable Tech KPI Dashboard in Google Sheets
This is the primary dashboard where all KPIs are displayed together.
Key Features:
-
Month dropdown available at Cell D3
Changing the month automatically updates:
- All KPI values
- MTD and YTD calculations
- Traffic-light colors
- Up and down arrow indicators
KPI Views Included:
-
MTD Actual, Target & Previous Year
-
Target vs Actual comparison
-
Previous Year vs Actual comparison
-
YTD Actual, Target & Previous Year
-
Visual variance indicators for quick decision-making
This sheet is perfect for leadership reviews, business updates, and performance monitoring.

Click to Buy Wearable Tech KPI Dashboard in Google Sheets
KPI Trend Sheet Tab
The KPI Trend Sheet allows deep-dive analysis of individual KPIs over time.
Features:
-
KPI selection dropdown available in Cell C3
Displays:
- KPI Group
- Unit of KPI
- KPI Type (Lower the Better / Upper the Better)
- KPI Formula
- KPI Definition
This sheet helps identify long-term performance trends and patterns for each wearable tech KPI.

Click to Buy Wearable Tech KPI Dashboard in Google Sheets
Actual Number Sheet Tab
This is where actual performance data is entered.
How It Works:
-
Enter MTD and YTD actual values for each KPI
-
Select the first month of the year in Cell E1
-
The dashboard automatically calculates cumulative YTD values
No complex formulas are required—just enter the data and the dashboard does the rest.

Click to Buy Wearable Tech KPI Dashboard in Google Sheets
Target Sheet Tab
The Target Sheet is used to define performance goals.
Key Functions:
-
Enter KPI targets for each month
-
Maintain both MTD and YTD targets
-
Targets feed directly into variance and performance indicators
This ensures clear benchmarking against planned goals.

Click to Buy Wearable Tech KPI Dashboard in Google Sheets
Previous Year Number Sheet Tab
This sheet stores historical performance data.
Purpose:
-
Enter previous year KPI values
-
Enables Year-over-Year (YoY) comparison
-
Supports PY vs Actual analysis on the dashboard
This is critical for understanding growth, decline, and seasonal patterns.

KPI Definition Sheet Tab
The KPI Definition Sheet acts as the backbone of the dashboard.
You can define:
- KPI Name
- KPI Group
- Unit (%, Units, Revenue, Score, etc.)
- Formula
- KPI Definition
This ensures consistency, transparency, and governance across all KPI calculations

Click to Buy Wearable Tech KPI Dashboard in Google Sheets
Advantages of the Wearable Tech KPI Dashboard
-
Saves time with automated reporting
-
Improves visibility across wearable tech performance
-
Aligns teams with clear KPI targets
-
Enables quick identification of performance gaps
-
Easy collaboration using Google Sheets
Opportunities for Improvement
-
Add automated alerts for underperforming KPIs
-
Extend analysis with region or product-level breakdowns
-
Integrate data from sales platforms or IoT systems
-
Add rolling forecasts and projections
Best Practices for Using the Dashboard
Click to Buy Wearable Tech KPI Dashboard in Google Sheets
-
Update actuals on a fixed monthly schedule
-
Review both MTD and YTD performance together
-
Keep KPI definitions updated as strategies evolve
-
Use trend analysis for root-cause identification
-
Align KPI targets with business objectives
Who Should Use This Dashboard?
Click to Buy Wearable Tech KPI Dashboard in Google Sheets
-
Wearable technology manufacturers
-
Consumer electronics companies
-
Product and operations managers
-
Sales and marketing teams
-
Strategy and leadership teams
Any organization involved in wearable tech development, sales, or operations can benefit from this KPI dashboard.
Final Thoughts
The Wearable Tech KPI Dashboard in Google Sheets is a powerful yet easy-to-use solution for tracking performance in a fast-moving industry. By combining structured KPI definitions, automated calculations, and intuitive visuals, this dashboard enables smarter decisions and better performance management.
Visit our YouTube channel to learn step-by-step video tutorials
Youtube.com/@NeotechNavigators
Watch the step-by-step video tutorial: