Emergency preparedness is no longer optional for modern organizations. From natural disasters and cyber incidents to fire hazards and power outages, offices must stay ready to respond quickly and effectively. However, many organizations still manage emergency planning data using scattered spreadsheets, static reports, or manual tracking methods. As a result, decision-makers often lack real-time visibility into preparedness levels, budget utilization, and risk exposure.Office Emergency Preparedness Dashboard in Google Sheets
That is exactly where the Office Emergency Preparedness Dashboard in Google Sheets becomes a powerful solution.
This ready-to-use dashboard helps organizations monitor emergency preparedness metrics, track budgets and damage costs, analyze risk levels, and evaluate vendor and department readiness—all in one centralized, interactive dashboard.Office Emergency Preparedness Dashboard in Google Sheets
What Is the Office Emergency Preparedness Dashboard in Google Sheets?
Click to Buy Office Emergency Preparedness Dashboard in Google Sheets
The Office Emergency Preparedness Dashboard in Google Sheets is a professionally designed analytics tool that enables organizations to track, analyze, and visualize emergency planning and response data using Google Sheets.
Instead of managing emergency drills, risk assessments, vendor participation, and cost data across multiple files, this dashboard brings everything together in one place. With interactive filters, dynamic charts, and automated calculations, users can instantly assess preparedness status and identify gaps.
This dashboard is ideal for facilities teams, safety officers, compliance managers, HR teams, and leadership who need accurate insights for emergency planning and risk mitigation.
Key Features of the Office Emergency Preparedness Dashboard in Google Sheets
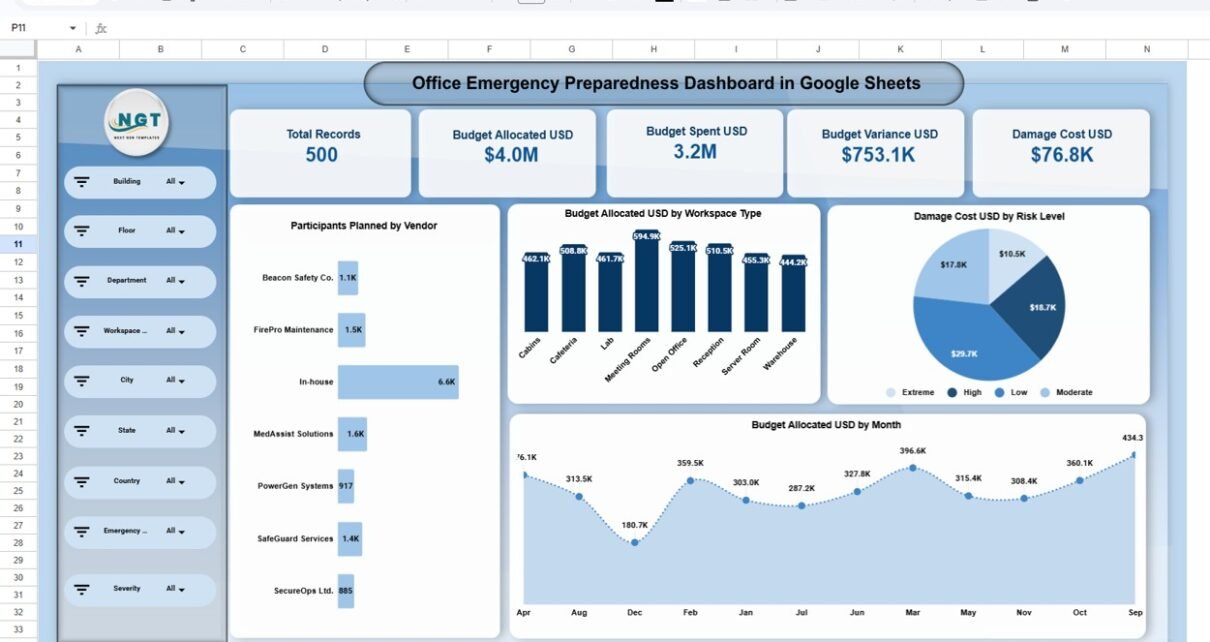
Centralized Emergency Preparedness Overview
The overview page provides a high-level snapshot of emergency readiness, including:
-
Total records
-
Budget allocated vs budget spent
-
Budget variance
-
Damage cost analysis
These KPIs help leadership quickly understand preparedness levels and financial exposure.
Interactive Filters for Deep Analysis
The dashboard includes dynamic slicers that allow users to analyze data by:
- Building
- Floor
- Department
- Workspace type
- City, state, and country
- Emergency type and severity
With a single click, users can drill down into specific locations or risk scenarios.

Click to Buy Office Emergency Preparedness Dashboard in Google Sheets
Emergency Type Analysis
This section analyzes emergency preparedness by emergency type such as:
- Fire
- Cyber incident
- Earthquake
- Flood
- Medical emergencies
- Power outages
- Severe weather
It highlights participants planned, budgets allocated, damage costs, and budget variance for each emergency type.

Click to Buy Office Emergency Preparedness Dashboard in Google Sheets
Department-Wise Preparedness Analysis
Understand how different departments contribute to preparedness by analyzing:
-
Participants planned by department
-
Budget allocated by department
-
Damage cost by department
-
Budget variance trends
This helps identify departments that may require additional training or resources.

Click to Buy Office Emergency Preparedness Dashboard in Google Sheets
🤝 Vendor Performance & Training Analysis
Evaluate emergency service vendors and internal teams by tracking:
-
Participants planned by vendor
-
Training score percentage by vendor
-
Participants attended
-
Budget variance by vendor
This ensures vendors meet preparedness expectations and training standards.

Click to Buy Office Emergency Preparedness Dashboard in Google Sheets
📈 Monthly Trends & Risk Insights
The dashboard includes trend analysis for:
-
Budget allocation by month
-
Damage cost by month
-
Injury counts
-
Average impact and risk levels
-
Budget variance over time
These insights help organizations plan proactively rather than reactively.

Click to Buy Office Emergency Preparedness Dashboard in Google Sheets
Advanced Search Functionality
A built-in search page allows users to:
-
Select any column
-
Enter a search keyword
-
Instantly filter and review relevant records
This feature is especially useful for audits, investigations, and compliance reviews.
Who Can Use This Dashboard?
This dashboard is ideal for:
-
Corporate safety and compliance teams
-
Facility and operations managers
-
Risk management professionals
-
Business continuity planners
-
HR and training departments
-
Corporate leadership and administrators
Whether you manage a single office or multiple locations, this dashboard scales effortlessly.
Advantages of the Office Emergency Preparedness Dashboard
Click to Buy Office Emergency Preparedness Dashboard in Google Sheets
-
Centralized emergency data in one dashboard
-
Real-time insights using Google Sheets
-
Easy-to-use filters and interactive charts
-
Better visibility into risks and preparedness gaps
-
Improved budget tracking and cost control
-
Faster decision-making during emergencies
Opportunities for Improvement
-
Integrate automated data imports from incident management systems
-
Add severity-based alert indicators
-
Extend the dashboard with compliance scoring
-
Connect with Google Forms for live incident reporting
-
nclude predictive risk indicators using historical data
Best Practices for Using the Dashboard
Click to Buy Office Emergency Preparedness Dashboard in Google Sheets
-
Update emergency data regularly to ensure accuracy
-
Review department and vendor performance monthly
-
Use trend analysis to identify recurring risks
-
Align preparedness budgets with high-risk areas
-
Share dashboard access with key stakeholders
-
Use insights to improve emergency drills and training
Why Use Google Sheets for Emergency Preparedness?
Google Sheets offers several advantages:
- Cloud-based access from anywhere
- Real-time collaboration
- No additional software installation
- Easy sharing and permissions control
- Scalable and cost-effective
This makes it an ideal platform for emergency planning dashboards.
Final Thoughts
Click to Buy Office Emergency Preparedness Dashboard in Google Sheets
The Office Emergency Preparedness Dashboard in Google Sheets transforms how organizations plan, monitor, and improve emergency readiness. By combining structured data, interactive visuals, and actionable insights, this dashboard helps organizations stay prepared, reduce risks, and protect both people and assets.
Visit our YouTube channel to learn step-by-step video tutorials
Youtube.com/@NeotechNavigators
Watch the step-by-step video tutorial:
Click to Buy Office Emergency Preparedness Dashboard in Google Sheets