Tissue engineering is a highly specialized and data-intensive field where success depends on precise monitoring of research efficiency, quality outcomes, cost control, and long-term performance trends. Managing these KPIs manually across multiple spreadsheets can quickly become time-consuming and error-prone.Tissue Engineering KPI Dashboard in Google Sheets
That is where the Tissue Engineering KPI Dashboard in Google Sheets becomes an essential tool.
This ready-to-use KPI dashboard helps research teams, biotech organizations, and life-science professionals track, analyze, and compare critical tissue engineering KPIs in a single, structured Google Sheets file.Tissue Engineering KPI Dashboard in Google Sheets
What Is the Tissue Engineering KPI Dashboard in Google Sheets?
Click to Buy Tissue Engineering KPI Dashboard in Google Sheets
The Tissue Engineering KPI Dashboard in Google Sheets is a professionally designed KPI tracking template that allows you to monitor performance across multiple dimensions such as productivity, efficiency, quality, timelines, and outcomes.
It provides:
-
Monthly and yearly KPI monitoring
-
Target vs Actual comparison
-
Previous Year vs Current Year analysis
-
Clear KPI definitions, formulas, and performance direction
All calculations and visuals update automatically based on user selections.
Key Features of the Tissue Engineering KPI Dashboard
-
Tracks all KPIs with Unit, Formula, Definition, and KPI Type
-
Supports Upper the Better (UTB) and Lower the Better (LTB) KPIs
-
Interactive Month selector for dynamic analysis
-
Automated MTD and YTD calculations
-
Visual performance indicators with:
-
Traffic light colors
-
Up and down arrows for variance
-
This dashboard is built entirely in Google Sheets, making it cloud-based, collaborative, and easy to customize.
Dashboard Structure – 6 Worksheets Explained
Click to Buy Tissue Engineering KPI Dashboard in Google Sheets
The dashboard is organized into logical worksheets to keep data entry, logic, and visualization clean and scalable.
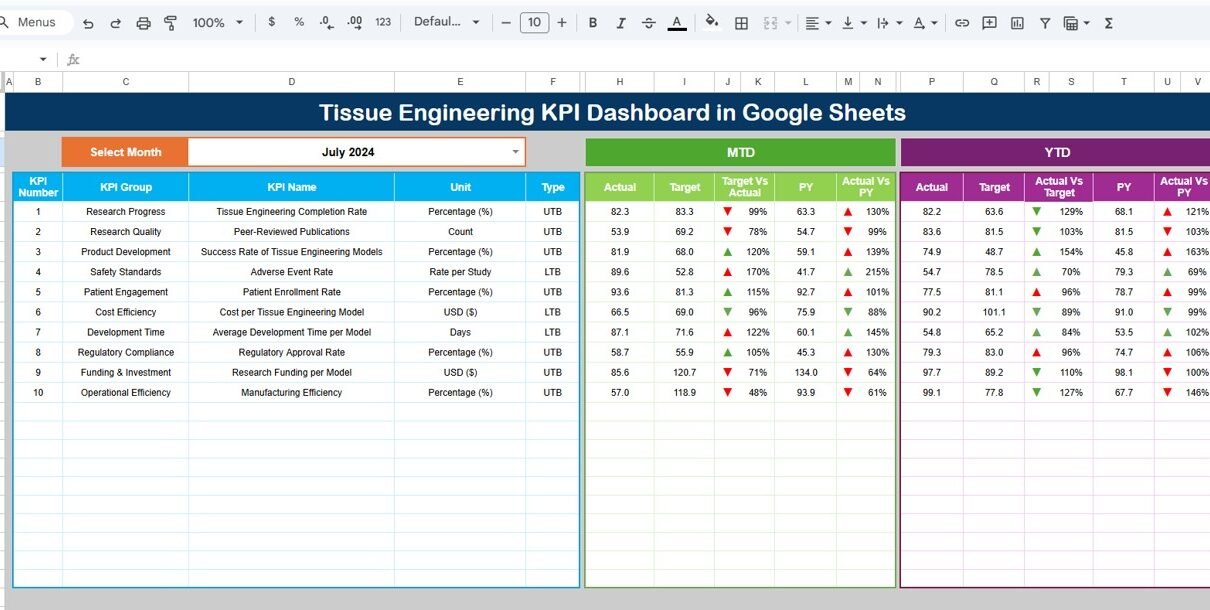
Dashboard Sheet Tab – KPI Overview
This is the main dashboard page where all KPIs are displayed at a glance.
🔹 How It Works
Month dropdown available at Cell D3
Selecting a month automatically updates:
- All KPI values
- Traffic light indicators
- Percentage change arrows
🔹 Metrics Displayed
-
MTD Actual, Target, Previous Year
-
YTD Actual, Target, Previous Year
-
Target vs Actual variance
-
Previous Year vs Actual variance
This page is ideal for management reviews and high-level performance tracking.

Click to Buy Tissue Engineering KPI Dashboard in Google Sheets
KPI Trend Sheet Tab – KPI-Wise Analysis
This sheet is designed for deep-dive analysis of individual KPIs.
🔹 Features
-
KPI selection dropdown at Cell C3
-
Displays:
- KPI Group
- KPI Unit
- KPI Type (UTB / LTB)
- KPI Formula
- KPI Definition
This ensures clarity and consistency in KPI interpretation across teams.

Click to Buy Tissue Engineering KPI Dashboard in Google Sheets
Actual Number Sheet Tab – Current Year Data Entry
This sheet is used to enter actual KPI values.
🔹 Data Entry Logic
-
Enter MTD and YTD actual values
-
Month selection available at Cell E1
-
Define only the first month of the year
-
Remaining months adjust automatically
This structure minimizes manual effort and reduces errors.

Click to Buy Tissue Engineering KPI Dashboard in Google Sheets
Target Sheet Tab – Performance Goals
This sheet stores target values for each KPI.
🔹 Key Points
-
Enter MTD and YTD target numbers
-
Targets feed directly into:
-
Variance calculations
-
Dashboard visuals
-
Trend analysis
-
This helps align research goals with operational performance.

Click to Buy Tissue Engineering KPI Dashboard in Google Sheets
Previous Year Number Sheet Tab – Historical Comparison
This sheet captures previous year KPI data.
🔹 Benefits
-
Enables year-over-year performance comparison
-
Highlights long-term improvements or declines
-
Supports strategic planning and benchmarking

Click to Buy Tissue Engineering KPI Dashboard in Google Sheets
KPI Definition Sheet Tab – KPI Master
This is the foundation of the entire dashboard.
🔹 Included Columns
- KPI Name
- KPI Group
- Unit
- Formula
- KPI Definition
- KPI Type (UTB / LTB)
Keeping all KPI logic in one place ensures transparency, consistency, and easy auditing.

Click to Buy Tissue Engineering KPI Dashboard in Google Sheets
Advantages of Using This KPI Dashboard
-
Centralized KPI tracking for tissue engineering projects
-
Saves time compared to manual reporting
-
Clear visibility into performance gaps
-
Easy comparison of actuals vs targets
-
Works entirely in Google Sheets
-
Reusable across years and projects
Opportunities for Improvement
-
Add automated data imports from lab or LIMS systems
-
Introduce project-wise or experiment-wise filters
-
Expand KPI library for regulatory and compliance tracking
-
Add predictive trend indicators
Best Practices for Maximum Value
Click to Buy Tissue Engineering KPI Dashboard in Google Sheets
-
Keep KPI definitions standardized
-
Update actual and target data monthly
-
Review UTB and LTB KPIs separately
-
Use YTD trends for long-term decision-making
-
Share read-only access with stakeholders
Who Should Use This Dashboard?
-
Tissue Engineering Research Teams
-
Biotechnology & Life-Science Companies
-
R&D and Innovation Teams
-
Quality and Process Improvement Teams
-
Research Program Managers
-
Data and Performance Analysts
Final Thoughts
Click to Buy Tissue Engineering KPI Dashboard in Google Sheets
The Tissue Engineering KPI Dashboard in Google Sheets is a powerful yet simple solution for tracking complex KPIs with clarity and confidence. It replaces scattered spreadsheets with a single, structured, and automated KPI system that supports better decisions and stronger performance management.
Visit our YouTube channel to learn step-by-step video tutorials
Youtube.com/@NeotechNavigators
Watch the step-by-step video tutorial:
Click to Buy Tissue Engineering KPI Dashboard in Google Sheets