Aquaculture businesses require constant monitoring of key metrics to ensure optimal production, sustainability, and profitability. The Aquaculture KPI Dashboard in Google Sheets is a ready-to-use solution that enables fishery managers, farm owners, and operations teams to track critical performance indicators in real-time.
This article explains the features, advantages, and best practices of using the Aquaculture KPI Dashboard to monitor MTD, YTD, and trend-based performance.
What Is an Aquaculture KPI Dashboard?
An Aquaculture KPI Dashboard is a visual tool that consolidates multiple farm performance metrics in one centralized location. It helps monitor operational efficiency, production metrics, water quality parameters, feed efficiency, and financial KPIs.
By using Google Sheets, farm managers can:
-
Track month-to-date (MTD) and year-to-date (YTD) metrics
-
Compare actual performance against targets and previous year data
-
Monitor trends for better decision-making
-
Evaluate sustainability and operational efficiency
Key Features of the Aquaculture KPI Dashboard
Click to Buy Aquaculture KPI Dashboard in Google Sheets
This dashboard includes 6 worksheets, each designed to provide unique insights:
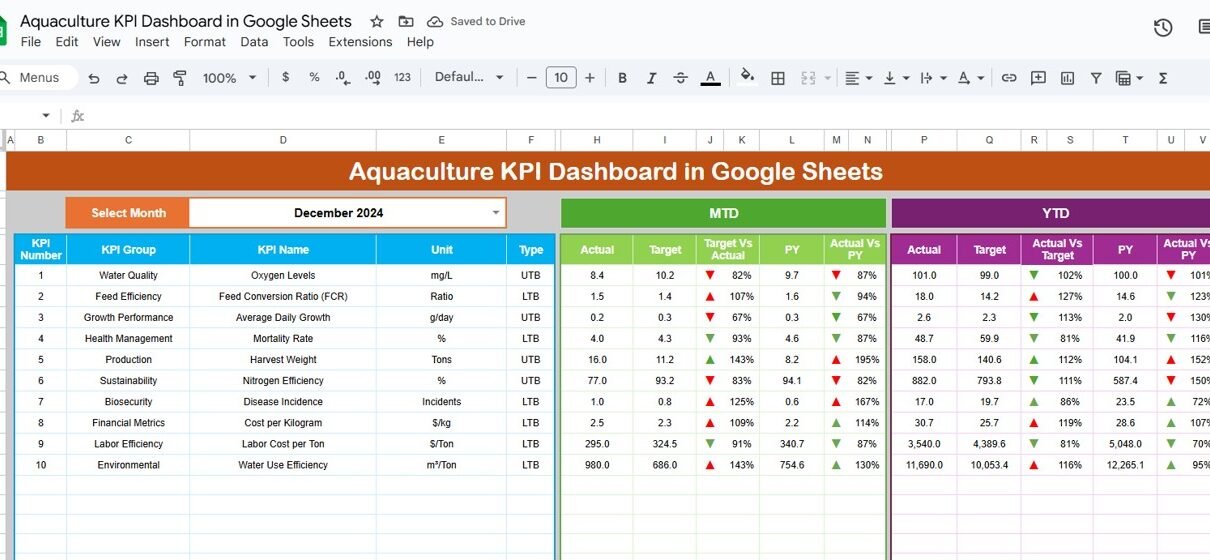
1. Dashboard Sheet Tab
The Dashboard Sheet is the main page, providing an overview of all KPIs.
Key features include:
-
Month Selection Dropdown (Range D3): Updates all metrics for the selected month automatically
-
MTD Metrics: Actual, Target, Previous Year data with conditional formatting arrows
-
YTD Metrics: Year-to-date performance metrics with up/down indicators
-
Comparison Metrics: Target vs Actual and PY vs Actual to track performance
This sheet provides a snapshot of farm operations for quick analysis.

Click to Buy Aquaculture KPI Dashboard in Google Sheets
2. KPI Trend Sheet Tab
The KPI Trend Sheet tracks individual KPIs over time:
-
Select KPI from dropdown (Range C3)
-
Displays KPI Group, Unit, and Type (Lower-the-Better or Upper-the-Better)
-
Shows KPI Formula and Definition
-
Trend visualization for MTD and YTD metrics
This sheet helps identify trends, bottlenecks, and areas for improvement.

3. Actual Number Sheet Tab
-
Enter actual values for all KPIs, both MTD and YTD
-
Change the first month of the year in Range E1 to adjust calculations dynamically
This ensures accurate real-time performance tracking.

Click to Buy Aquaculture KPI Dashboard in Google Sheets
4. Target Sheet Tab
-
Input target values for each KPI
-
Supports both MTD and YTD targets
-
Facilitates comparison of planned versus actual performance

5. Previous Year Number Sheet Tab
-
Enter the previous year’s KPI values
-
Allows year-over-year analysis to evaluate growth and performance improvements

Click to Buy Aquaculture KPI Dashboard in Google Sheets
6. KPI Definition Sheet Tab
Define each KPI including:
- KPI Name
- KPI Group
- Unit
- Formula
- Definition
- Type (Lower-the-Better / Upper-the-Better)
This sheet ensures clarity and consistency across the dashboard.

Examples of Aquaculture KPIs
Click to Buy Aquaculture KPI Dashboard in Google Sheets
Some common KPIs tracked in aquaculture include:
-
Total Production (Kg): Total harvest weight
-
Feed Conversion Ratio (FCR): Feed efficiency metric (Lower-the-Better)
-
Mortality Rate (%): Percentage of stock loss (Lower-the-Better)
-
Water Quality Index: Measure of dissolved oxygen, pH, and ammonia levels
-
Revenue ($): Total sales revenue from aquaculture products
-
Cost per Kg ($): Production cost per kilogram (Lower-the-Better)
Each KPI should include:
-
Unit of Measure (Kg, %, $, etc.)
-
Formula for calculation
-
Performance Type (Lower-the-Better or Upper-the-Better)
Advantages of Using the Aquaculture KPI Dashboard
-
Centralized Data: Monitor all farm metrics in one sheet
-
Real-Time Insights: Updates automatically as new data is entered
-
Track Performance: Compare MTD, YTD, and previous year metrics
-
Identify Bottlenecks: Spot areas with poor feed efficiency or high mortality
-
Data-Driven Decisions: Optimize production and resource allocation
-
Customizable: Add or modify KPIs based on farm-specific needs
Best Practices for Using the Dashboard
Click to Buy Aquaculture KPI Dashboard in Google Sheets
-
Update Actual Numbers Promptly: Maintain accurate MTD and YTD values
-
Monitor Trends Regularly: Use KPI Trend sheet to identify seasonal patterns
-
Set Realistic Targets: Ensure target values align with farm goals
-
Segment KPIs: Analyze by pond, tank, species, or production batch
-
Review Year-over-Year Metrics: Compare with previous year to track improvements
-
Use Conditional Formatting: Quickly spot KPIs that are above or below target
How This Dashboard Helps Aquaculture Managers
-
Optimize Production: Track feed conversion and mortality for better output
-
Monitor Water Quality: Ensure optimal conditions for healthy stock
-
Track Financial Performance: Compare revenue and costs across periods
-
Identify Trends: Recognize high-performing ponds, species, or tanks
-
Make Informed Decisions: Plan resource allocation, harvests, and operational changes
Frequently Asked Questions (FAQs)
Click to Buy Aquaculture KPI Dashboard in Google Sheets
Q1: Can I add new KPIs to this dashboard?
Yes, you can add additional KPIs in the KPI Definition sheet and update the Actual, Target, and Previous Year sheets accordingly.
Q2: How often should the data be updated?
It is recommended to update monthly or whenever production data is available.
Q3: Can I compare multiple ponds or tanks?
Yes, segment your KPIs by pond, tank, or species for detailed analysis.
Q4: Is this dashboard suitable for large aquaculture operations?
Yes, Google Sheets can handle large datasets, and the dashboard can be scaled to include multiple sites.
Q5: How do I interpret Lower-the-Better and Upper-the-Better KPIs?
Lower-the-Better KPIs indicate improvement when the number decreases (e.g., mortality), while Upper-the-Better improves as numbers increase (e.g., production).
Conclusion
Click to Buy Aquaculture KPI Dashboard in Google Sheets
The Aquaculture KPI Dashboard in Google Sheets provides a comprehensive, visual, and ready-to-use tool to monitor farm performance. With MTD, YTD, and trend analysis, managers can track production, optimize resources, and make data-driven decisions to improve efficiency and profitability.
Visit our YouTube channel to learn step-by-step video tutorials
Youtube.com/@NeotechNavigators
Watch the step-by-step video Demo: