Industrial manufacturing organizations operate in a highly competitive and efficiency-driven environment. Production targets, quality standards, costs, safety, and delivery timelines must stay under constant control. However, many manufacturing teams still rely on manual spreadsheets and disconnected reports. As a result, visibility drops and decision-making slows down.
That is exactly where an Industrial Manufacturing KPI Dashboard in Google Sheets delivers strong value.
In this detailed article, you will learn what an Industrial Manufacturing KPI Dashboard in Google Sheets is, how it works, its worksheet-wise structure, key KPIs with units and definitions, advantages, best practices, and frequently asked questions. By the end, you will clearly understand how this ready-to-use dashboard helps manufacturing teams track performance and take data-driven actions.
What Is an Industrial Manufacturing KPI Dashboard in Google Sheets?
An Industrial Manufacturing KPI Dashboard in Google Sheets is a centralized performance-tracking solution that monitors key manufacturing KPIs across production, quality, cost, delivery, and efficiency.
Instead of reviewing multiple sheets or reports, this dashboard consolidates all KPI data into one interactive system. Moreover, because it runs on Google Sheets, teams can collaborate in real time and access insights from anywhere.
As a result, managers gain complete visibility into plant performance at both monthly and year-to-date levels.
Why Is an Industrial Manufacturing KPI Dashboard Important?
Click to Buy Industrial Manufacturing KPI Dashboard in Google Sheets
Manufacturing success depends on consistent monitoring and quick corrective actions. Therefore, KPI tracking becomes essential.
Here is why this dashboard matters:
- It tracks performance against targets clearly
- It compares actuals with previous year results
- It highlights gaps using visual indicators
- It improves accountability across departments
- It reduces manual reporting effort
Because Google Sheets is widely used, this dashboard fits easily into existing workflows.
How Does the Industrial Manufacturing KPI Dashboard Work?
This dashboard works by separating KPI structure, data entry, and visualization into dedicated worksheets.
First, KPI definitions define what to measure. Then, actuals, targets, and previous year data feed the system. After that, the dashboard calculates MTD and YTD performance automatically. Finally, conditional formatting highlights performance trends using up and down arrows.
Because of this structure, users focus on insights rather than calculations.
What Worksheets Are Included in the Dashboard?
Click to Buy Industrial Manufacturing KPI Dashboard in Google Sheets
The Industrial Manufacturing KPI Dashboard in Google Sheets includes six structured worksheets, each with a specific purpose.
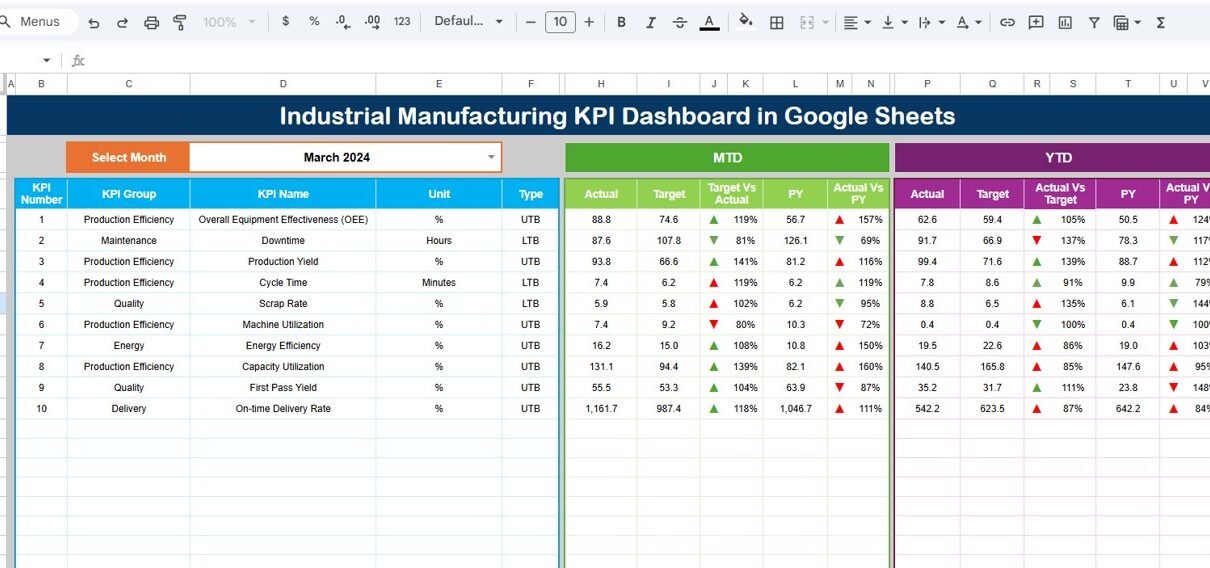
Dashboard Sheet Tab
The Dashboard Sheet Tab is the main interface.
Key Features of the Dashboard Sheet
-
Month selector on cell D3
-
Dynamic refresh of all KPI values
-
MTD and YTD performance comparison
-
Target vs Actual indicators
-
Previous Year vs Actual indicators
-
Conditional formatting with up/down arrows
KPIs Displayed
-
MTD Actual, Target, Previous Year
-
YTD Actual, Target, Previous Year
-
Variance analysis for both MTD and YTD
Because everything appears on one screen, leadership can review performance instantly.

Click to Buy Industrial Manufacturing KPI Dashboard in Google Sheets
KPI Trend Sheet Tab?
The KPI Trend Sheet Tab focuses on deep analysis of a single KPI.
Key Features
- KPI selector dropdown on cell C3
- Displays KPI Group
- Shows KPI Unit
- Indicates KPI Type (LTB or UTB)
- Shows KPI Formula
- Displays KPI Definition
This sheet helps users understand KPI behavior and historical movement clearly.

Click to Buy Industrial Manufacturing KPI Dashboard in Google Sheets
Actual Number Sheet
The Actual Number Sheet Tab captures real performance data.
Key Features
- Month selection on cell E1
- Entry of MTD Actual values
- Entry of YTD Actual values
- Simple and structured input layout
Users only enter numbers, while calculations update automatically.

Click to Buy Industrial Manufacturing KPI Dashboard in Google Sheets
Target Sheet Tab?
The Target Sheet Tab defines performance expectations.
Key Features
-
Monthly MTD target entry
-
Monthly YTD target entry
-
KPI-wise target structure
Because targets drive performance comparison, this sheet plays a critical role.

Click to Buy Industrial Manufacturing KPI Dashboard in Google Sheets
Previous Year Number Sheet Tab
The Previous Year Number Sheet Tab supports historical comparison.
Key Features
- Previous year MTD values
- Previous year YTD values
- Same structure as current year data
This sheet enables year-over-year performance analysis.

Click to Buy Industrial Manufacturing KPI Dashboard in Google Sheets
KPI Definition Sheet Tab
The KPI Definition Sheet Tab acts as the foundation of the dashboard.
Fields Included
- KPI Name
- KPI Group
- Unit
- Formula (Aggregation logic)
- KPI Definition
- KPI Type (Lower the Better / Upper the Better)
Because KPI clarity is critical, this sheet ensures consistent understanding across teams.

Click to Buy Industrial Manufacturing KPI Dashboard in Google Sheets
Advantages of Industrial Manufacturing KPI Dashboard in Google Sheets
Using this dashboard delivers strong operational benefits.
Key Advantages
-
Centralized KPI Monitoring
-
Real-Time Performance Visibility
-
Clear Target Tracking
-
Improved Accountability
-
Easy Collaboration
-
Cost-Effective Solution
-
No Advanced BI Tools Required
Because of these advantages, manufacturing teams move from reactive management to proactive control.
Who Should Use This KPI Dashboard?
This dashboard suits multiple roles.
Ideal Users
- Plant managers
- Production heads
- Operations managers
- Manufacturing analysts
- Quality and safety teams
- Industrial engineers
If your role involves performance monitoring, this dashboard fits perfectly.
How Does This Dashboard Improve Decision-Making?
Click to Buy Industrial Manufacturing KPI Dashboard in Google Sheets
This dashboard improves decisions by:
- Highlighting underperforming KPIs
- Comparing targets vs actuals clearly
- Tracking improvement trends
- Supporting data-backed reviews
- Reducing reporting delays
As a result, leadership acts faster and more confidently.
Best Practices for the Industrial Manufacturing KPI Dashboard in Google Sheets
Follow these best practices to maximize dashboard value.
1. Keep KPI Definitions Clear
Always maintain accurate formulas and definitions.
2. Update Data Monthly
Consistent updates ensure reliable insights.
3. Protect Formula Sheets
Lock calculation and dashboard sheets.
4. Review Variances Regularly
Focus on KPIs with negative trends first.
5. Align Targets with Business Goals
Set realistic and meaningful targets.
How Is This Dashboard Better Than Traditional Manufacturing Reports?
Click to Buy Industrial Manufacturing KPI Dashboard in Google Sheets
Unlike static reports, this dashboard:
- Updates dynamically by month
- Shows MTD and YTD together
- Highlights performance gaps visually
- Saves hours of manual reporting
Therefore, it acts as a performance management system, not just a report.
Conclusion
An Industrial Manufacturing KPI Dashboard in Google Sheets is a powerful and practical solution for tracking manufacturing performance. It combines KPI definitions, actuals, targets, and historical data into one interactive system.
Moreover, its structured worksheet design, conditional formatting, and trend analysis help teams monitor performance accurately and take timely actions. By using this dashboard, manufacturing organizations improve efficiency, reduce waste, and achieve consistent operational excellence.
Frequently Asked Questions (FAQs)
Click to Buy Industrial Manufacturing KPI Dashboard in Google Sheets
What is an Industrial Manufacturing KPI Dashboard in Google Sheets?
It is an interactive dashboard that tracks manufacturing KPIs like production, quality, cost, delivery, and safety in Google Sheets.
Does this dashboard support MTD and YTD analysis?
Yes, it shows both MTD and YTD actuals, targets, and previous year comparisons.
Can I customize KPIs in this dashboard?
Yes, you can add, remove, or modify KPIs easily using the KPI Definition sheet.
Is this dashboard suitable for multiple plants?
Yes, it can be extended to support multiple plants or production lines.
Does it require advanced Google Sheets skills?
No, it is designed for easy use with structured inputs and automation.
Can this replace manual KPI reports?
Yes, it significantly reduces manual reporting and improves accuracy.
Visit our YouTube channel to learn step-by-step video tutorials
Youtube.com/@NeotechNavigators
Watch the step-by-step video tutorial:
Click to Buy Industrial Manufacturing KPI Dashboard in Google Sheets