Satellite communication plays a critical role in modern connectivity. From broadcasting and navigation to defense, weather monitoring, and global internet coverage, satellite networks support essential services worldwide. However, managing satellite communication performance without proper monitoring tools leads to inefficiencies, delays, and service disruptions.
That is exactly where a Satellite Communication KPI Dashboard in Google Sheets becomes extremely valuable.
This article explains what a Satellite Communication KPI Dashboard in Google Sheets is, why it is important, how it works, its worksheets, key features, KPIs with units and logic, advantages, best practices, and frequently asked questions. By the end, you will clearly understand how this dashboard helps satellite operators, engineers, and managers make data-driven decisions.
What Is a Satellite Communication KPI Dashboard in Google Sheets?
A Satellite Communication KPI Dashboard in Google Sheets is a ready-to-use, interactive reporting solution that tracks and analyzes key performance indicators related to satellite operations.
Instead of managing multiple reports and tools, teams use one centralized Google Sheets dashboard to:
- Monitor satellite communication performance
- Track MTD and YTD metrics
- Compare actual performance with targets
- Analyze previous year results
- Identify performance issues early
Because Google Sheets supports formulas, drop-downs, charts, and conditional formatting, this dashboard remains both powerful and easy to use.
Why Do Organizations Need a Satellite Communication KPI Dashboard?
Click to Buy Satellite Communication KPI Dashboard in Google Sheets
Satellite operations involve complex systems and high costs. Therefore, continuous monitoring becomes essential.
However, manual tracking often creates delays and errors. A KPI dashboard solves this challenge effectively.
Key Reasons to Use a Satellite Communication KPI Dashboard
- To monitor network performance consistently
- To track service quality and availability
- To reduce downtime and signal loss
- To improve capacity planning
- To support management reporting
As a result, organizations move from reactive operations to proactive performance management.
How Does a Satellite Communication KPI Dashboard in Google Sheets Work?
The dashboard works through a structured worksheet design. Each worksheet plays a specific role. Together, all sheets form a complete KPI tracking system.
Users enter actual values, target values, and previous year data. Then, formulas automatically calculate MTD, YTD, target variance, and year-over-year comparisons.
Consequently, the dashboard updates instantly based on the selected month.
What Are the Key Features of the Satellite Communication KPI Dashboard?
Click to Buy Satellite Communication KPI Dashboard in Google Sheets
This dashboard includes multiple well-structured worksheets designed for performance tracking and analysis.
Let us explore each worksheet in detail.
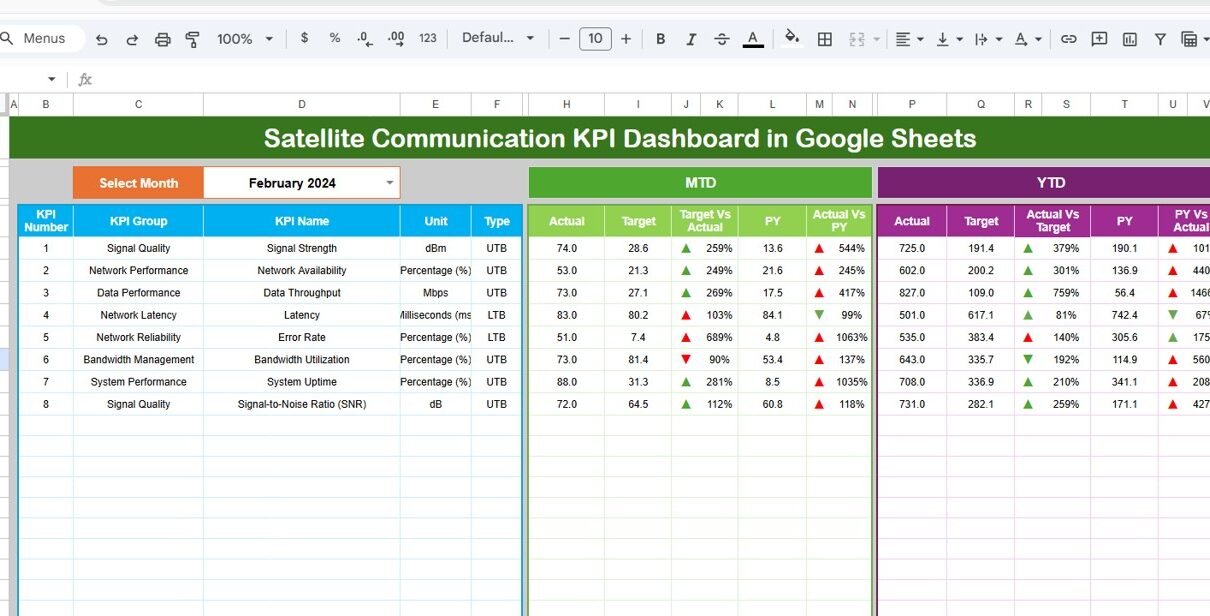
1. What Is the Dashboard Sheet in Google Sheets?
The Dashboard Sheet acts as the main page of the KPI dashboard.
Key Features of the Dashboard Sheet
-
Displays all satellite KPIs in one view
-
Month selection available in cell D3
-
Dynamic update of all numbers based on selected month
KPI Metrics Displayed on the Dashboard
-
MTD Actual
-
MTD Target
-
MTD Previous Year
-
Target vs Actual (MTD)
-
PY vs Actual (MTD)
-
YTD Actual
-
YTD Target
-
YTD Previous Year
-
Target vs Actual (YTD)
-
PY vs Actual (YTD)
The dashboard also uses conditional formatting with up and down arrows, making performance status instantly visible.

Click to Buy Satellite Communication KPI Dashboard in Google Sheets
2. How Does the KPI Trend Sheet Help Analysis?
The KPI Trend Sheet supports detailed KPI-level analysis.
Features of the KPI Trend Sheet
-
KPI selection drop-down in cell C3
-
Displays KPI Group
-
Displays KPI Unit
-
Shows KPI Type (Lower the Better or Upper the Better)
-
Shows KPI Formula
-
Shows KPI Definition
Because this sheet focuses on trends, teams quickly understand performance behavior over time.

Click to Buy Satellite Communication KPI Dashboard in Google Sheets
3. What Is the Actual Number Sheet?
The Actual Number Sheet captures real operational data.
How This Sheet Works
-
Enter MTD and YTD actual values
-
Select the starting month of the year in cell E1
-
Automatically aligns data month-wise
Since this sheet feeds the dashboard, accurate data entry remains critical.

Click to Buy Satellite Communication KPI Dashboard in Google Sheets
4. What Is the Target Sheet?
The Target Sheet stores performance benchmarks.
Purpose of the Target Sheet
-
Enter MTD target values
-
Enter YTD target values
-
Support target vs actual comparisons
As a result, teams clearly understand whether satellite performance meets expectations.

Click to Buy Satellite Communication KPI Dashboard in Google Sheets
5. What Is the Previous Year Number Sheet?
The Previous Year Number Sheet enables year-over-year analysis.
Why This Sheet Is Important
-
Stores last year’s MTD and YTD data
-
Enables PY vs Actual comparison
-
Highlights improvement or decline
Because historical comparison supports strategic planning, this sheet adds strong analytical value.

6. What Is the KPI Definition Sheet?
The KPI Definition Sheet acts as a reference table for all KPIs.
Information Stored in the KPI Definition Sheet
- KPI Name
- KPI Group
- Unit of Measurement
- Formula to Aggregate
- KPI Definition
- KPI Type (Lower the Better or Upper the Better)
Since all KPI logic remains documented, the dashboard stays transparent and easy to understand.

Click to Buy Satellite Communication KPI Dashboard in Google Sheets
Advantages of Satellite Communication KPI Dashboard in Google Sheets
This dashboard offers strong operational and management benefits.
1. Improves Performance Visibility
The dashboard displays all KPIs in one place. Therefore, teams gain instant clarity.
2. Enables Faster Decision-Making
Dynamic calculations and visual indicators support quick actions.
3. Reduces Manual Reporting Effort
Automated formulas eliminate repetitive calculations.
4. Supports Remote Collaboration
Google Sheets allows real-time collaboration across teams.
5. Improves Data Consistency
Centralized data entry reduces reporting errors.
6. Offers Cost-Effective Solution
Google Sheets removes the need for expensive software tools.
How Does This Dashboard Improve Satellite Operations?
Click to Buy Satellite Communication KPI Dashboard in Google Sheets
Satellite operations require continuous monitoring. This dashboard highlights deviations early using arrows and comparisons.
As a result:
- Teams respond faster to signal issues
- Downtime reduces significantly
- Service quality improves
Best Practices for the Satellite Communication KPI Dashboard in Google Sheets
Follow these best practices to maximize dashboard effectiveness.
1. Define KPIs Clearly
Always document KPIs properly in the KPI Definition Sheet.
2. Maintain Accurate Data
Update actual, target, and previous year data carefully.
3. Review Dashboard Monthly
Analyze MTD and YTD performance regularly.
4. Standardize Units
Use consistent units across all KPIs.
5. Protect the Dashboard
Limit editing rights to avoid accidental changes.
6. Use Conditional Formatting Wisely
Ensure arrow indicators align correctly with KPI type.
Who Should Use a Satellite Communication KPI Dashboard?
Click to Buy Satellite Communication KPI Dashboard in Google Sheets
This dashboard benefits:
- Satellite Operations Teams
- Network Engineers
- Performance Analysts
- Operations Managers
- Strategy and Planning Teams
Because Google Sheets remains familiar, adoption becomes easy.
Conclusion
A Satellite Communication KPI Dashboard in Google Sheets provides a structured, reliable, and collaborative solution for monitoring satellite performance. It simplifies complex data, highlights issues early, and supports data-driven decision-making.
With MTD and YTD tracking, trend analysis, target comparison, and KPI definitions, this dashboard helps organizations move toward proactive satellite performance management.
Frequently Asked Questions (FAQs)
Click to Buy Satellite Communication KPI Dashboard in Google Sheets
What is a Satellite Communication KPI Dashboard in Google Sheets?
It is an interactive dashboard that tracks satellite performance KPIs using Google Sheets.
Can I customize KPIs in this dashboard?
Yes, you can easily add, remove, or modify KPIs.
Does this dashboard support MTD and YTD analysis?
Yes, it supports both MTD and YTD metrics along with target and previous year comparison.
Is Google Sheets suitable for operational dashboards?
Yes, Google Sheets supports formulas, collaboration, and automation effectively.
Who should maintain this dashboard?
Operations analysts or performance monitoring teams should update and review it regularly.
Visit our YouTube channel to learn step-by-step video tutorials
Youtube.com/@NeotechNavigators
Watch the step-by-step video tutorial:
Click to Buy Satellite Communication KPI Dashboard in Google Sheets