The mining industry runs on precision, safety, and performance control. Every day, companies extract materials worth millions. However, even small inefficiencies can reduce profit margins significantly. Therefore, mining companies must track production, safety, cost, and operational KPIs carefully.
Yet, many mining operations still depend on scattered spreadsheets. As a result, management struggles to monitor performance in real time.
So, how can mining companies monitor monthly and yearly performance in one dynamic system?
The answer is simple.
You need a Mining KPI Scorecard in Google Sheets.
This ready-to-use Google Sheets template helps you track 10 critical KPIs using traffic lights, up/down arrows, MTD and YTD views, and dynamic month selection. Moreover, it automatically updates numbers and indicators when you select a different month.
What Is a Mining KPI Scorecard in Google Sheets?
Click to Buy Mining KPI Scorecard in Google Sheets
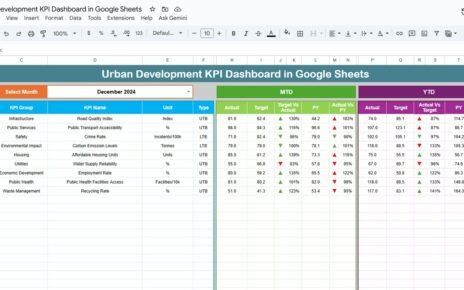
A Mining KPI Scorecard in Google Sheets is a structured performance tracking template that measures key mining operational indicators on a monthly and yearly basis.
This scorecard includes:
-
Month dropdown selection at the top
-
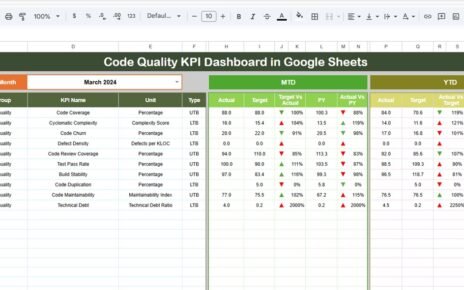
MTD (Month-To-Date) view
-
YTD (Year-To-Date) view
-
Traffic light indicators (Red, Yellow, Green)
-
Percentage change with up/down arrows
-
KPI trend sheet
-
KPI definition sheet
-
Data input sheet
-
Color settings customization
Therefore, mining managers can instantly evaluate performance trends without complex software.
Why Do Mining Companies Need a KPI Scorecard?
Click to Buy Mining KPI Scorecard in Google Sheets
Mining operations involve:
-
Heavy machinery
-
High labor costs
-
Strict safety regulations
-
Large fuel consumption
-
Production volume targets
Without KPI monitoring, companies face:
-
Production delays
-
Increased operational cost
-
Higher accident rates
-
Equipment downtime
-
Reduced profitability
However, when companies use a KPI scorecard, they gain performance clarity. As a result, they improve operational efficiency and cost control.
Structure of the Mining KPI Scorecard in Google Sheets
This template contains multiple worksheets, each designed for a specific purpose.
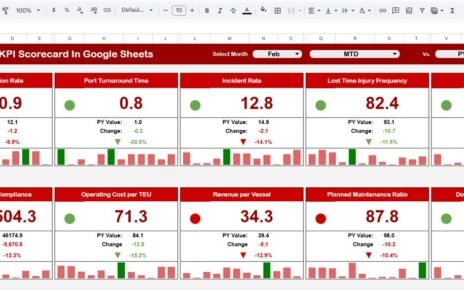
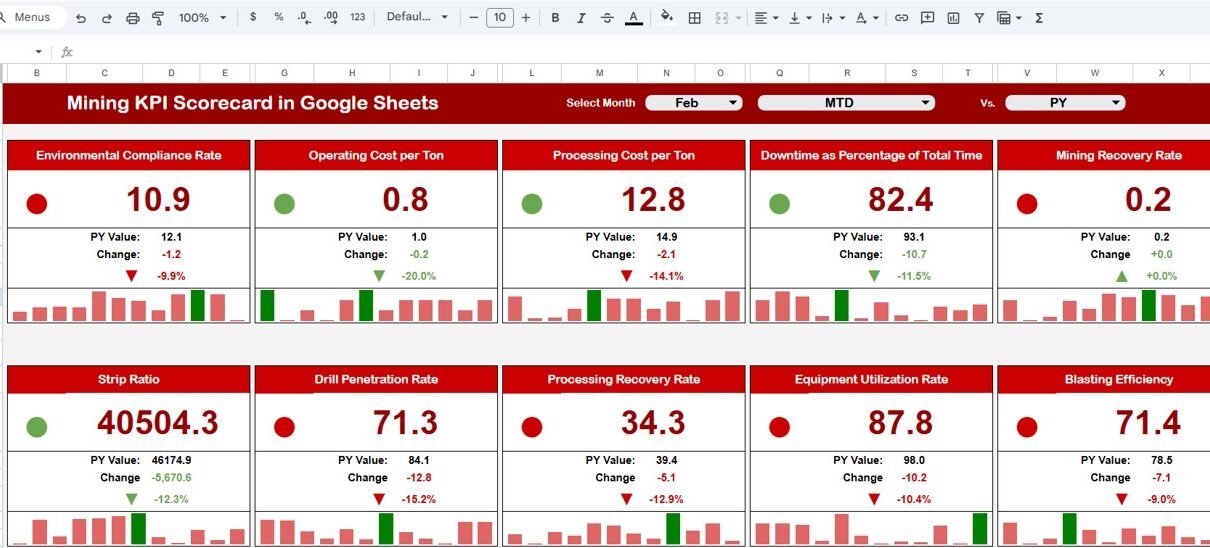
1️⃣ Main Scorecard Sheet – How Does It Work?
This is the primary performance dashboard.
Key Features:
-
Month dropdown at the top
-
Automatically updates all numbers
-
Traffic light indicators
-
Up/down arrows showing percentage change
-
Toggle between MTD and YTD views
When you select a different month, the entire scorecard updates automatically. Therefore, managers can review monthly performance instantly.
Visual Indicators Include:
-
Green: Performance meets or exceeds target
-
Yellow: Performance slightly below target
-
Red: Performance below target
-
Up Arrow: Improvement from previous period
-
Down Arrow: Decline from previous period

Click to Buy Mining KPI Scorecard in Google Sheets
2️⃣ Trend Sheet Tab – How Can You Analyze KPI Trends?
In this sheet:
-
Select KPI from dropdown in Range C3
-
View KPI Group
-
Unit of KPI
-
KPI Type (Lower the Better or Upper the Better)
-
Formula
-
KPI Definition
-
Trend chart for selected KPI
This sheet allows detailed analysis of any specific KPI over time.

3️⃣ KPI Definition Sheet Tab – Where Do You Define KPIs?
This sheet includes:
-
KPI Name
-
KPI Group
-
Unit
-
Formula
-
KPI Definition
It ensures KPI clarity and consistency across departments.

Click to Buy Mining KPI Scorecard in Google Sheets
4️⃣ Data Input Sheet Tab – Where Do You Enter Data?
This sheet stores all raw KPI data.
You input:
-
Monthly KPI values
-
Target values
-
Previous month data
-
Yearly cumulative values
The scorecard automatically pulls data from this sheet.

Click to Buy Mining KPI Scorecard in Google Sheets
5️⃣ Colour Settings Sheet – How Do You Control Indicators?
This sheet allows customization of:
-
Traffic light colors
-
Threshold percentages
-
Performance benchmarks
Therefore, you can align visual indicators with company standards.

Advantages of Mining KPI Scorecard in Google Sheets
Real-Time Monthly Monitoring
You instantly review performance by selecting a month.
Visual Performance Indicators
Traffic lights make performance interpretation simple.
Clear Accountability
Managers track KPI responsibility clearly.
Cost Control Improvement
You monitor cost per ton and fuel efficiency easily.
Safety Performance Tracking
You track incident rates consistently.
Simple and Customizable
Google Sheets allows easy modification without technical complexity.
Best Practices for the Mining KPI Scorecard
Click to Buy Mining KPI Scorecard in Google Sheets
Define Clear KPI Targets
Always align targets with company goals.
Update Data Regularly
Input monthly data without delay.
Review MTD and YTD Together
Monthly review shows short-term performance. YTD review shows long-term trends.
Monitor Safety Metrics Closely
Safety must remain a priority.
Use Color Indicators Wisely
Avoid setting unrealistic thresholds.
Train Managers on Interpretation
Ensure users understand KPI formulas and definitions.
How Does This Scorecard Improve Mining Operations?
Click to Buy Mining KPI Scorecard in Google Sheets
The Mining KPI Scorecard improves performance because it:
- Identifies inefficiencies quickly
- Highlights cost overruns
- Improves equipment utilization
- Reduces downtime
- Enhances safety management
- Increases profitability
Therefore, companies maintain better operational control and financial stability.
Conclusion
Mining operations demand structured performance monitoring. However, traditional reporting slows down decision-making.
The Mining KPI Scorecard in Google Sheets provides a ready-to-use solution with dynamic month selection, traffic light indicators, MTD/YTD views, trend analysis, and KPI definitions.
If your organization wants better cost control, improved safety, and higher productivity, this scorecard delivers the clarity you need.
Frequently Asked Questions with Answers
Click to Buy Mining KPI Scorecard in Google Sheets
Can I customize the KPIs?
Yes. You can add or modify KPIs in the KPI Definition sheet.
Does the scorecard update automatically?
Yes. It updates when you select a different month.
Can small mining companies use it?
Yes. Both small and large operations can use this template.
Do I need advanced skills?
No. Basic Google Sheets knowledge is enough.
Can I modify traffic light thresholds?
Yes. You can adjust them in the Colour Settings sheet.
Visit our YouTube channel to learn step-by-step video tutorials
Youtube.com/@NeotechNavigators
Watch the step-by-step video tutorial: