Modern organizations handle hundreds of internal requests every month. These requests may include IT support tickets, facility maintenance issues, procurement requests, HR inquiries, compliance tasks, and operational approvals. Because different departments handle these requests, tracking them manually becomes extremely challenging.
Many organizations still rely on scattered spreadsheets or emails to manage administrative requests. As a result, managers often struggle to monitor request status, track escalation levels, prioritize urgent tasks, and evaluate department performance.
However, a centralized analytics system can solve this problem effectively. This is where the Administration Dashboard in Google Sheets becomes extremely useful.
The Administration Dashboard in Google Sheets is a ready-to-use analytical tool designed to help organizations track service requests, monitor escalation levels, analyze department performance, and evaluate operational efficiency. Because Google Sheets works in the cloud, teams can access the dashboard from anywhere and collaborate in real time.
In this article, you will learn everything about the Administration Dashboard in Google Sheets, including its features, benefits, analytical capabilities, best practices, and implementation strategies.
What Is an Administration Dashboard in Google Sheets?
Click to Buy Administration Dashboard in Google Sheets
An Administration Dashboard in Google Sheets is a visual reporting system that tracks operational requests and internal service performance within an organization.
The dashboard transforms raw administrative data into interactive charts, KPI cards, and analytical insights. As a result, managers can quickly understand request trends, department workloads, and priority levels.
Instead of reviewing multiple spreadsheets, organizations can monitor all administrative activities in one centralized dashboard.
Typical metrics tracked in an administration dashboard include:
- Total service requests
- Completed requests
- Pending requests
- Escalated issues
- High-priority tasks
- Department performance
- Regional performance
- Request type analysis
- Monthly operational trends
Because Google Sheets allows cloud-based collaboration, teams can update the data simultaneously and monitor operational performance in real time.
Why Do Organizations Need an Administration Dashboard?
Administrative operations often involve multiple departments and service categories. Therefore, without proper tracking, request management becomes inefficient.
An Administration Dashboard in Google Sheets helps organizations:
- Monitor service request status
- Track escalation levels
- Identify department workload
- Improve response time
- Analyze request types
- Monitor regional performance
- Improve internal service efficiency
Consequently, managers gain clear visibility into operational performance.
Key Features of the Administration Dashboard in Google Sheets
Click to Buy Administration Dashboard in Google Sheets
The dashboard contains multiple analytical pages designed to provide insights into different operational areas.
Interactive Filters
The dashboard includes filters on the left side that allow users to analyze data based on:
- Year
- Month
- Department
- Region
- Status
- Priority
- Request Type
These filters enable users to quickly explore different aspects of operational performance.
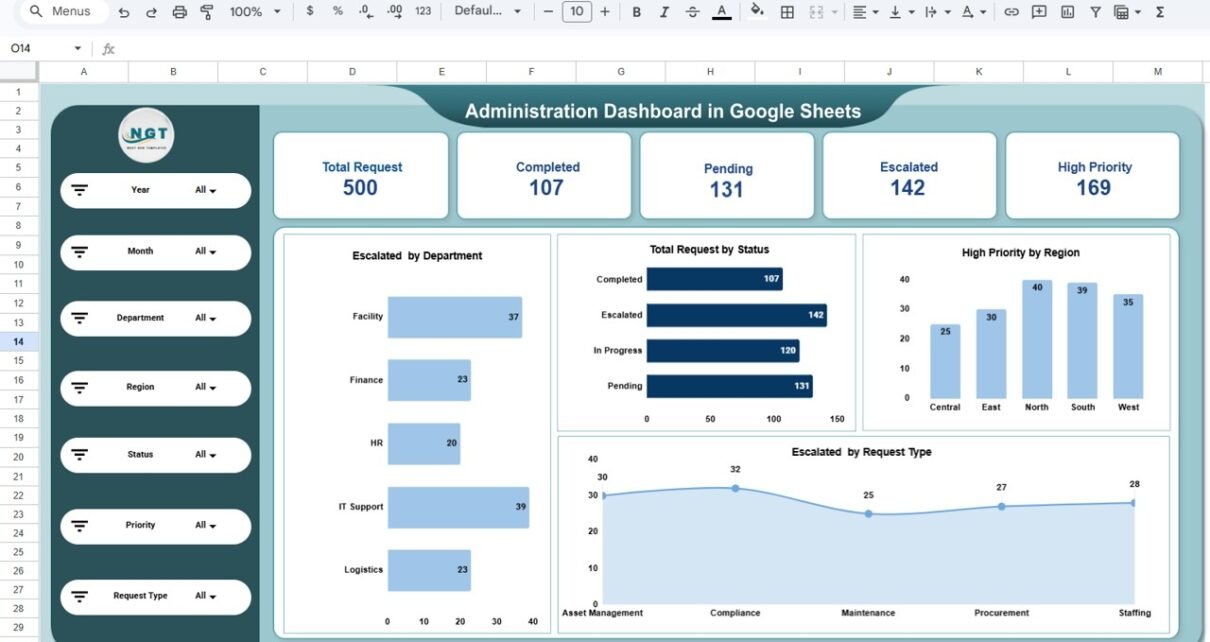
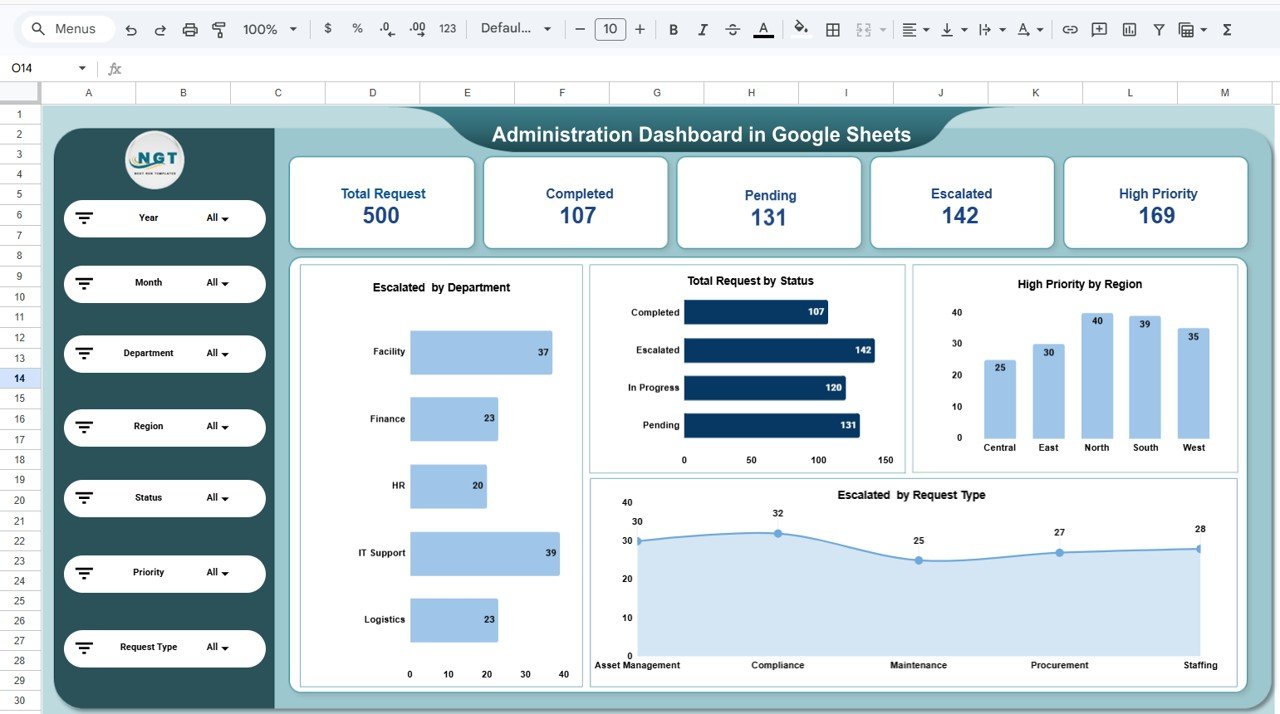
Overview Page: What Does the Main Administration Dashboard Show?
The Overview Page provides a high-level summary of administrative operations.
Managers can instantly review overall operational performance using KPI cards and charts.
Key KPI Indicators
The dashboard displays important KPIs such as:
-
Total Requests
-
Completed Requests
-
Pending Requests
-
Escalated Requests
-
High Priority Requests
These KPIs help managers quickly understand the operational workload.
Charts Included in the Overview Page
The dashboard includes several analytical charts:
-
Escalated Requests by Department
-
Total Requests by Status
-
High Priority Requests by Region
-
Escalated Requests by Request Type
These charts help identify problem areas and operational bottlenecks.
Click to Buy Administration Dashboard in Google Sheets
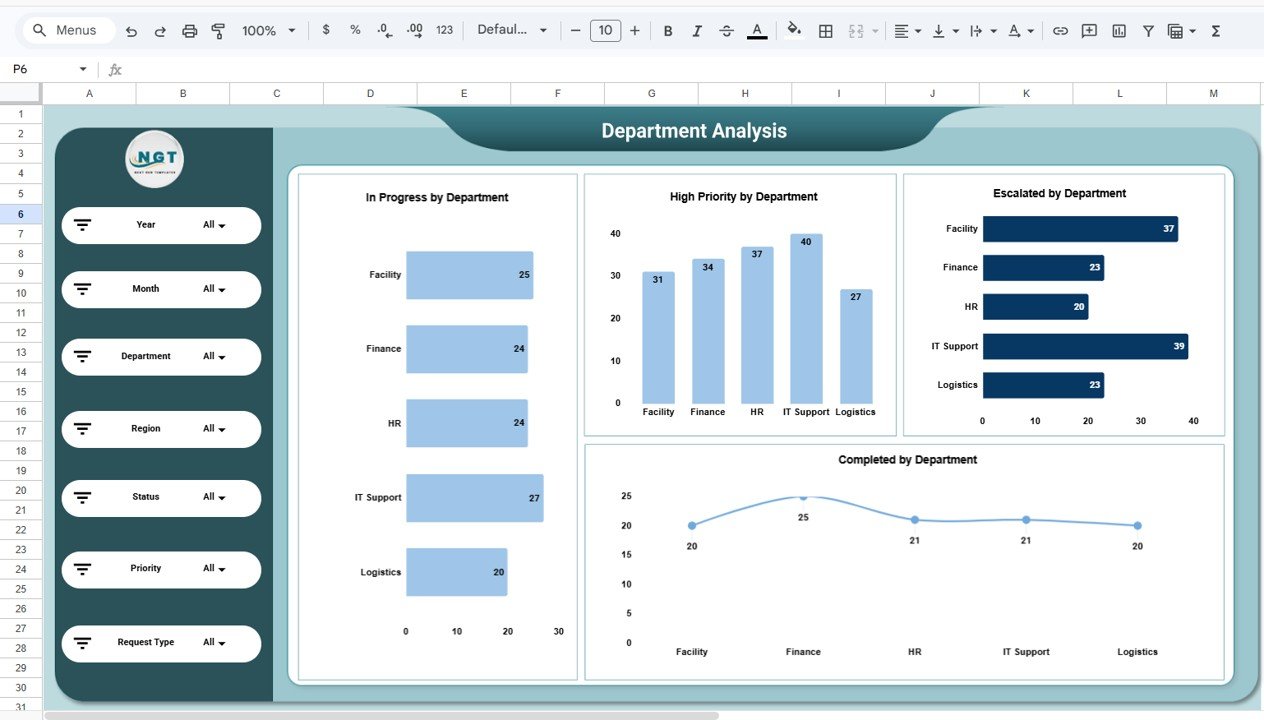
Department Analysis: How Do Different Departments Handle Requests?
Different departments receive different types of operational requests. Therefore, analyzing department performance is extremely important.
The Department Analysis Page focuses on department-level performance monitoring.
Charts Included in Department Analysis
This page includes:
-
In Progress Requests by Department
-
High Priority Requests by Department
-
Escalated Requests by Department
-
Completed Requests by Department
Insights from Department Analysis
Managers can easily:
-
Identify overloaded departments
-
Track request resolution efficiency
-
Monitor escalation patterns
-
Improve resource allocation
Consequently, organizations can balance department workloads more effectively.
Click to Buy Administration Dashboard in Google Sheets
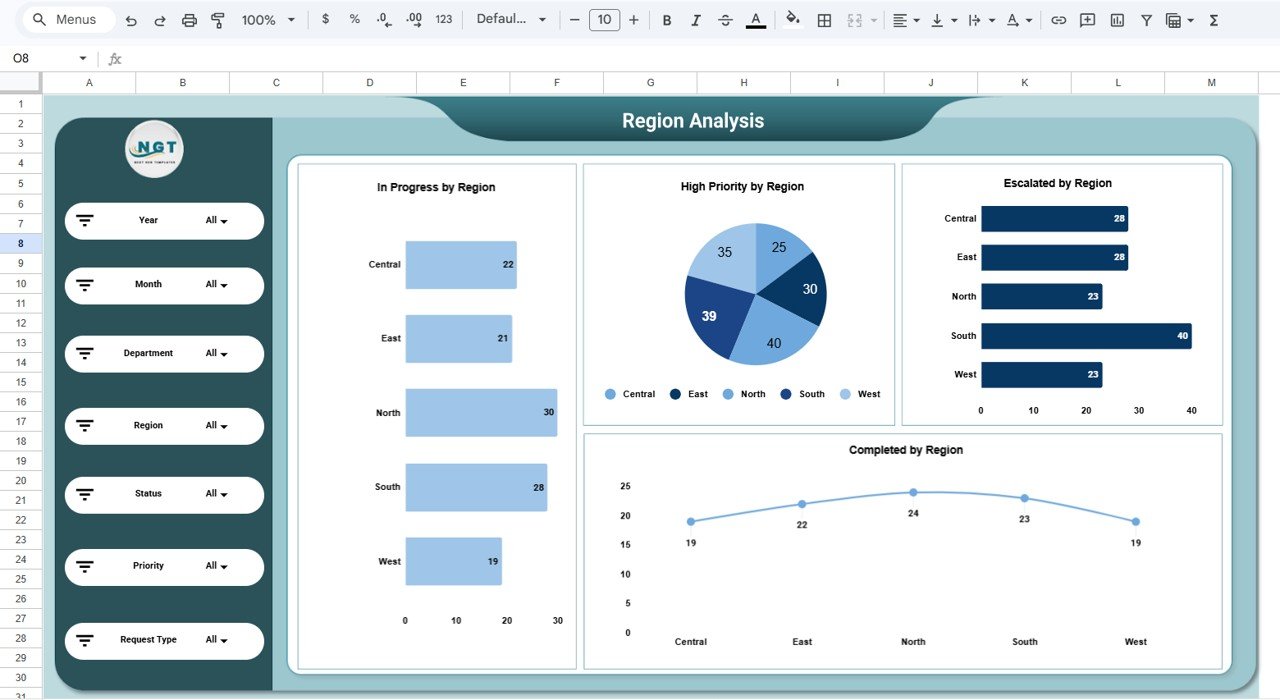
Region Analysis: How Do Operational Requests Vary by Location?
Large organizations often operate across multiple regions. Each region may experience different operational challenges.
The Region Analysis Page helps organizations understand regional service performance.
Charts Included in Region Analysis
This page includes:
-
In Progress Requests by Region
-
High Priority Requests by Region
-
Escalated Requests by Region
-
Completed Requests by Region
Insights from Region Analysis
Managers can:
-
Compare operational efficiency across regions
-
Identify regions with frequent escalations
-
Monitor service quality in different locations
-
Allocate resources to high-demand regions
Therefore, organizations can maintain consistent operational performance across locations.
Click to Buy Administration Dashboard in Google Sheets
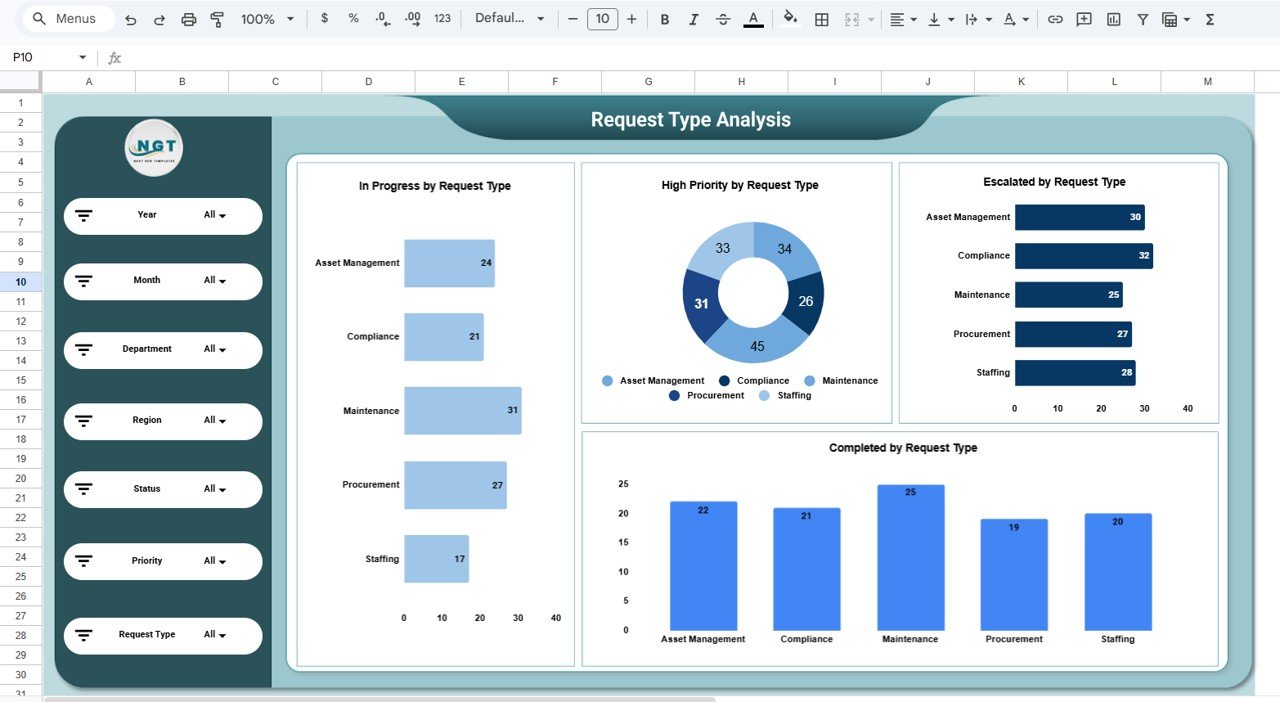
Request Type Analysis: Which Operational Services Generate the Most Requests?
Organizations receive requests related to various service categories such as:
-
Asset Management
- Compliance
- Maintenance
- Procurement
- Staffing
The Request Type Analysis Page helps managers analyze service demand.
Charts Included in Request Type Analysis
This page includes:
- In Progress Requests by Request Type
- High Priority Requests by Request Type
- Escalated Requests by Request Type
- Completed Requests by Request Type
Insights from Request Type Analysis
Managers can:
- Identify the most common service requests
- Monitor escalation levels for each service type
- Improve service processes
- Optimize department resource allocation
As a result, organizations can improve operational efficiency.
Click to Buy Administration Dashboard in Google Sheets
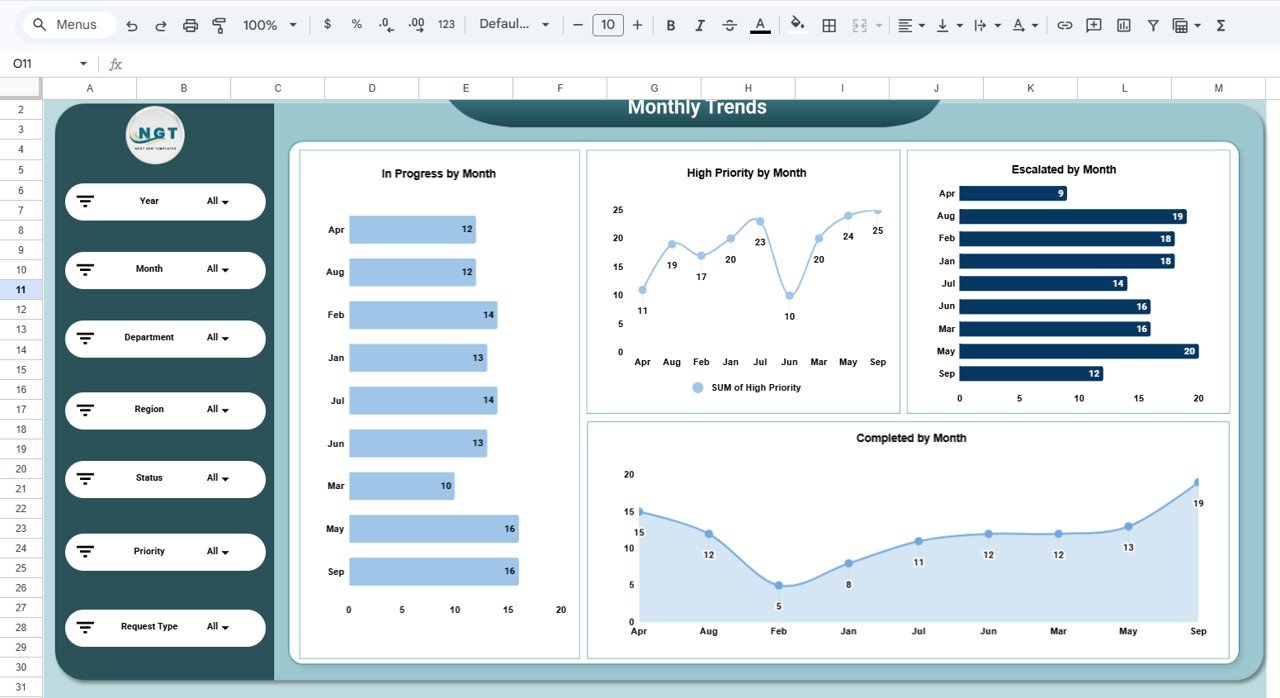
Monthly Trends: How Do Administrative Requests Change Over Time?
Operational workload often fluctuates throughout the year. Therefore, tracking monthly trends helps organizations plan resources effectively.
The Monthly Trends Page analyzes time-based performance changes.
Charts Included in Monthly Trends
This page includes:
- In Progress Requests by Month
- High Priority Requests by Month
- Escalated Requests by Month
- Completed Requests by Month
Insights from Monthly Trends
Managers can analyze:
- Seasonal request patterns
- Monthly escalation trends
- Service performance improvements
- Workload growth over time
Thus, organizations can plan staffing and resources more effectively.
Click to Buy Administration Dashboard in Google Sheets
Advantages of the Administration Dashboard in Google Sheets
The dashboard provides several advantages for organizations.
Improved Request Visibility
-
Managers can monitor all service requests in one place.
-
Teams can track request status quickly.
Faster Issue Resolution
-
Escalated requests become visible immediately.
-
Teams can prioritize urgent tasks.
Better Resource Allocation
-
Managers can identify overloaded departments.
-
Teams can balance workloads more efficiently.
Enhanced Decision-Making
-
Visual charts simplify complex operational data.
-
Leaders can make faster decisions.
Real-Time Collaboration
-
Google Sheets enables cloud-based collaboration.
-
Teams can update data from anywhere.
Opportunities for Improvement in Administrative Analytics
Click to Buy Administration Dashboard in Google Sheets
Although dashboards provide strong insights, organizations can enhance their analytics further.
Automate Request Tracking
Integrate the dashboard with ticketing systems.
Add Response Time KPIs
Track average request resolution time.
Monitor Employee Productivity
Analyze individual performance metrics.
Integrate Workflow Automation
Automate request assignment and notifications.
These improvements can significantly strengthen administrative operations.
Best Practices for the Administration Dashboard in Google Sheets
Organizations should follow several best practices to maintain an effective dashboard.
Maintain Clean Data
-
Avoid duplicate records
-
Use consistent naming conventions
-
Validate data regularly
Update Data Frequently
-
Add new requests regularly
-
Update request status promptly
Focus on Key Performance Metrics
Track metrics such as:
-
Total Requests
-
Escalated Requests
-
Resolution Rate
-
High Priority Requests
-
Average Response Time
Keep the Dashboard Simple
Avoid excessive charts and focus on meaningful insights.
Conclusion
Click to Buy Administration Dashboard in Google Sheets
Administrative operations play a critical role in maintaining organizational efficiency. However, managing internal service requests without proper analytics can lead to delays, escalations, and inefficiencies.
The Administration Dashboard in Google Sheets provides a powerful solution for tracking service requests, monitoring department performance, analyzing escalation patterns, and improving operational efficiency.
Because the dashboard converts raw operational data into clear visual insights, managers can quickly identify problem areas and take corrective action.
As organizations continue to grow and manage larger volumes of requests, implementing a data-driven administration dashboard becomes essential for improving service quality and operational performance.
Visit our YouTube channel to learn step-by-step video tutorials
Youtube.com/@NeotechNavigators
Watch the step-by-step video tutorial: