Employee morale plays a critical role in the success of every organization. When employees feel motivated, valued, and satisfied with their work environment, they naturally become more productive and engaged. However, many companies struggle to measure employee morale effectively because the data often remains scattered across surveys, HR reports, and internal spreadsheets.
Therefore, organizations increasingly rely on data-driven HR analytics to understand employee engagement and workplace satisfaction. One of the most effective tools for this purpose is the Employee Morale KPI Dashboard in Google Sheets.
The Employee Morale KPI Dashboard in Google Sheets is a ready-to-use and interactive reporting template designed to help HR teams monitor employee satisfaction, engagement levels, retention metrics, and workplace performance indicators. Moreover, the dashboard transforms raw HR data into clear insights using dynamic charts, KPI indicators, and structured reports.
Because Google Sheets provides cloud-based collaboration and powerful calculations, HR teams can easily track morale metrics, compare targets with actual performance, and analyze workforce trends.
In this comprehensive guide, we will explore the Employee Morale KPI Dashboard in Google Sheets, including its features, dashboard structure, KPI framework, advantages, best practices, and frequently asked questions.
What is an Employee Morale KPI Dashboard in Google Sheets?
An Employee Morale KPI Dashboard in Google Sheets is an HR analytics tool used to measure and monitor employee engagement, job satisfaction, workplace culture, and productivity.
Instead of manually analyzing multiple HR reports, managers can quickly evaluate employee morale using a centralized dashboard.
The dashboard typically tracks key HR metrics such as:
- Employee engagement score
- Absenteeism rate
- Employee turnover rate
- Training participation
- Employee satisfaction levels
- Internal promotion rate
Because these metrics appear in an interactive dashboard, HR leaders can easily identify morale issues and take corrective action.
Why is Employee Morale Important for Organizations?
Click to Buy Employee Morale KPI Dashboard in Google Sheets
Employee morale directly impacts business performance. When morale remains high, employees show higher productivity, creativity, and commitment.
However, low morale often results in:
- High employee turnover
- Reduced productivity
- Increased absenteeism
- Poor teamwork
- Lower job satisfaction
Therefore, companies must continuously monitor morale indicators.
With the Employee Morale KPI Dashboard in Google Sheets, HR teams can track these indicators systematically and make better workforce management decisions.
Key Features of the Employee Morale KPI Dashboard in Google Sheets
The Employee Morale KPI Dashboard offers a structured system to monitor HR performance metrics. Moreover, it provides automated KPI calculations and visual insights.
Key features include:
- Interactive dashboard with monthly analysis
- Month selection using dropdown menus
- KPI trend analysis for performance tracking
- Conditional formatting indicators for quick insights
- Separate worksheets for data input and KPI definitions
- MTD and YTD KPI comparisons
- Previous year comparison analysis
Because of these features, HR teams can easily monitor employee morale trends.
Structure of the Employee Morale KPI Dashboard
Click to Buy Employee Morale KPI Dashboard in Google Sheets
The dashboard includes six structured worksheets, each serving a specific purpose.
These worksheets include:
- Dashboard Sheet
- KPI Trend Sheet
- Actual Number Sheet
- Target Sheet
- Previous Year Number Sheet
- KPI Definition Sheet
Each worksheet plays an important role in organizing and analyzing HR data.
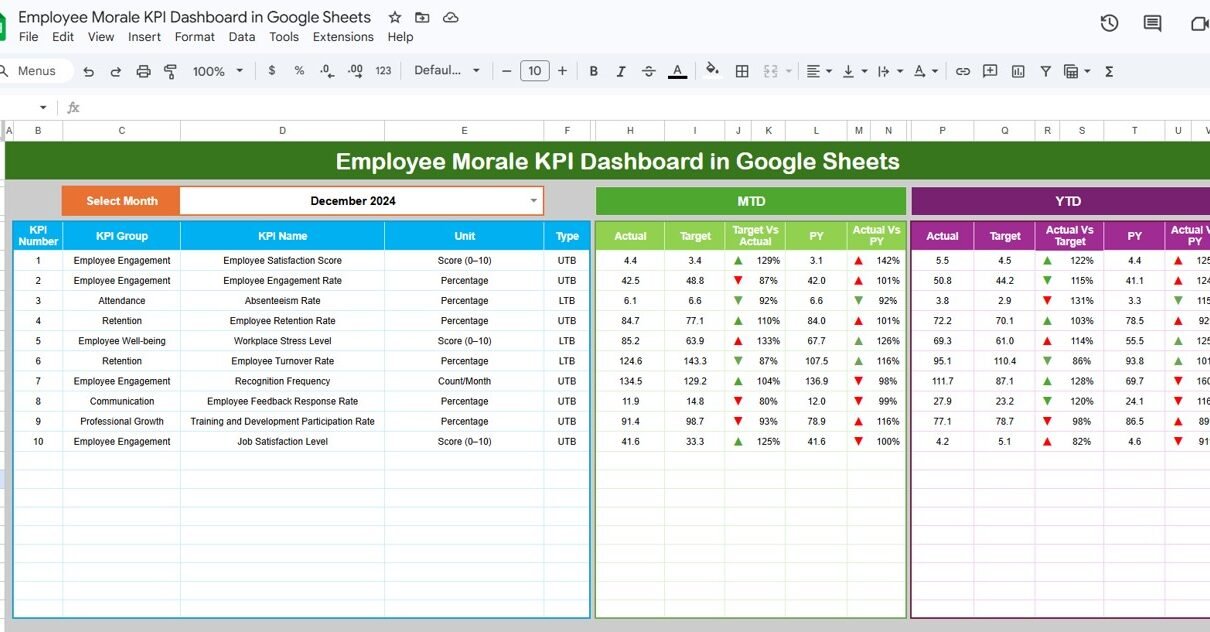
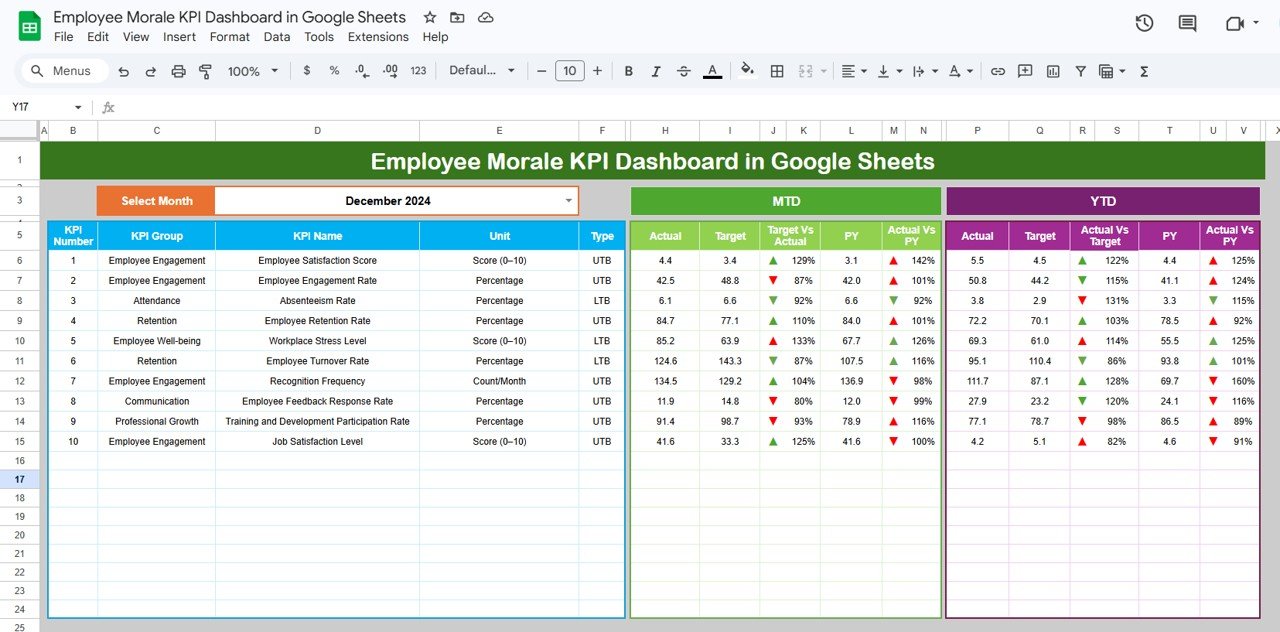
Dashboard Sheet – Main KPI Monitoring Page
The Dashboard Sheet acts as the main interface of the template. HR managers can review all KPIs from this page.
At cell D3, users can select the month from a dropdown list. Once the month changes, the entire dashboard automatically updates.
The dashboard displays several important KPI metrics.
MTD KPI Metrics
The dashboard includes the following Month-to-Date metrics:
- MTD Actual
- MTD Target
- Previous Year MTD
- Target vs Actual (MTD)
- PY vs Actual (MTD)
Conditional formatting icons display KPI status.
-
▲ Green arrow indicates positive performance
-
▼ Red arrow indicates negative performance
These indicators allow HR managers to quickly evaluate KPI performance.
YTD KPI Metrics
The dashboard also shows Year-to-Date metrics.
These include:
- YTD Actual
- YTD Target
- Previous Year YTD
- Target vs Actual (YTD)
- PY vs Actual (YTD)
Because of these comparisons, HR teams can evaluate long-term employee morale trends.
Click to Buy Employee Morale KPI Dashboard in Google Sheets
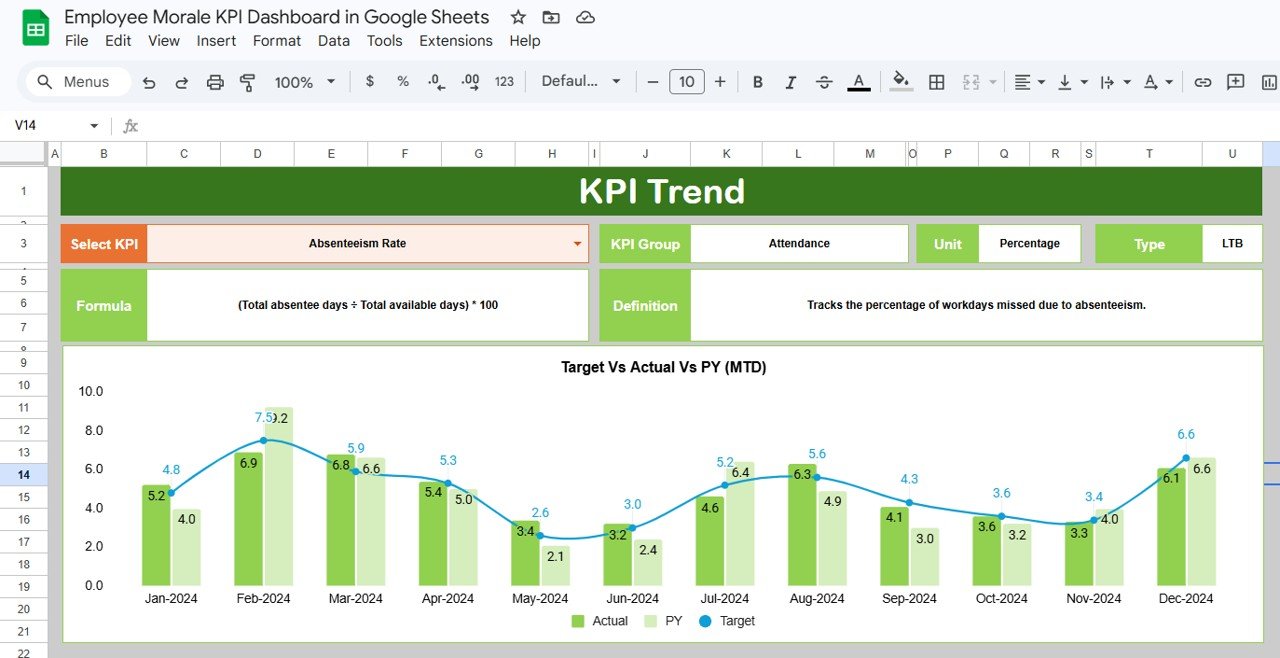
KPI Trend Sheet – Analyze KPI Performance Trends
The KPI Trend Sheet helps HR managers analyze KPI performance over time.
On cell C3, users can select a specific KPI from the dropdown list.
Once selected, the sheet displays detailed KPI information.
Information shown on this sheet includes:
- KPI Group
- KPI Unit
- KPI Type (Lower the Better or Upper the Better)
- KPI Formula
- KPI Definition
Additionally, the sheet displays charts that show KPI performance trends across months.
Because of these charts, HR managers can easily identify patterns and improvement areas.
Click to Buy Employee Morale KPI Dashboard in Google Sheets
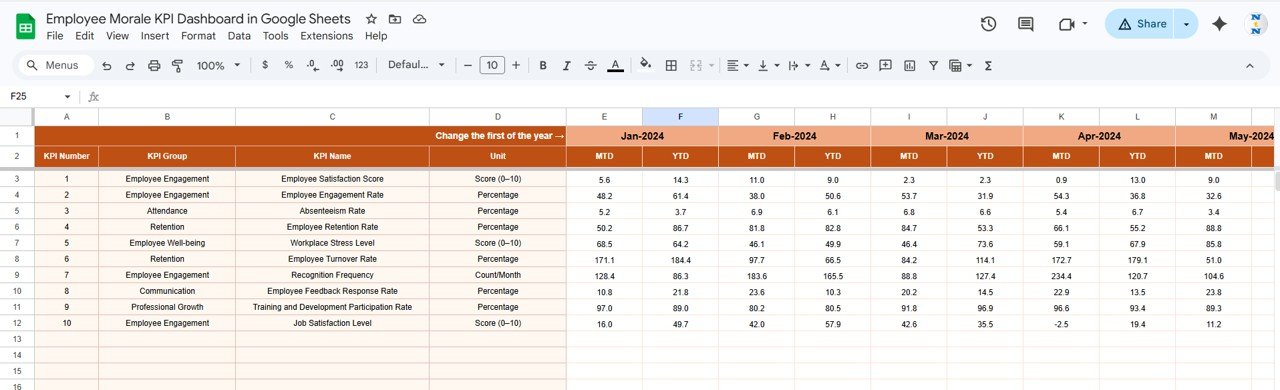
Actual Number Sheet – Input Current Performance Data
The Actual Number Sheet stores the actual KPI values.
Users must enter:
- KPI values for each month
- MTD numbers
- YTD numbers
The month selection appears at cell E1, where users must enter the first month of the year.
Once HR teams update the actual values, the dashboard automatically refreshes all KPI calculations.
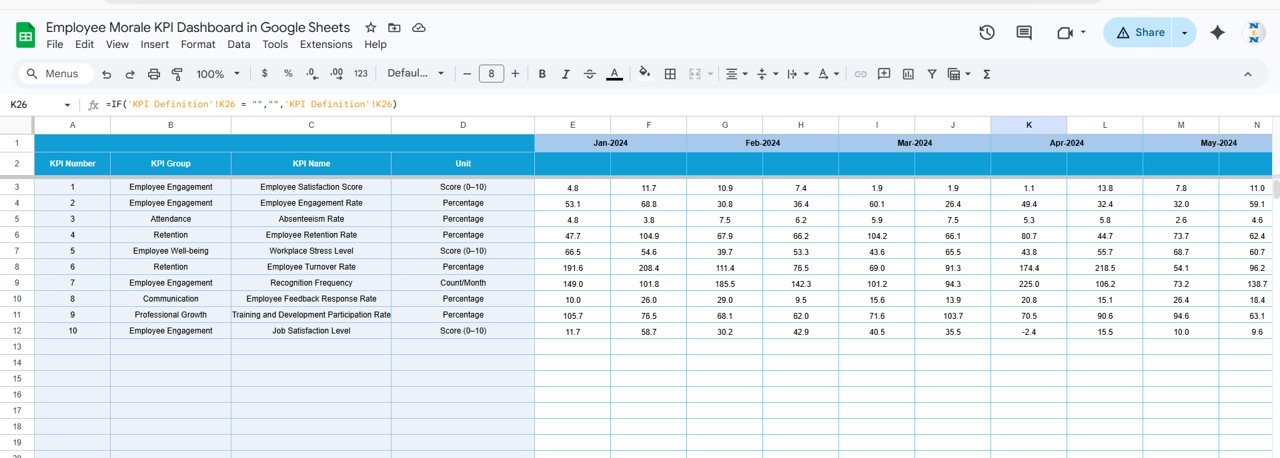
Target Sheet – Define KPI Targets
The Target Sheet contains the target values for each KPI.
Users must enter target numbers for:
- MTD performance
- YTD performance
Because the dashboard compares actual results with these targets, HR teams can easily identify performance gaps.
Click to Buy Employee Morale KPI Dashboard in Google Sheets
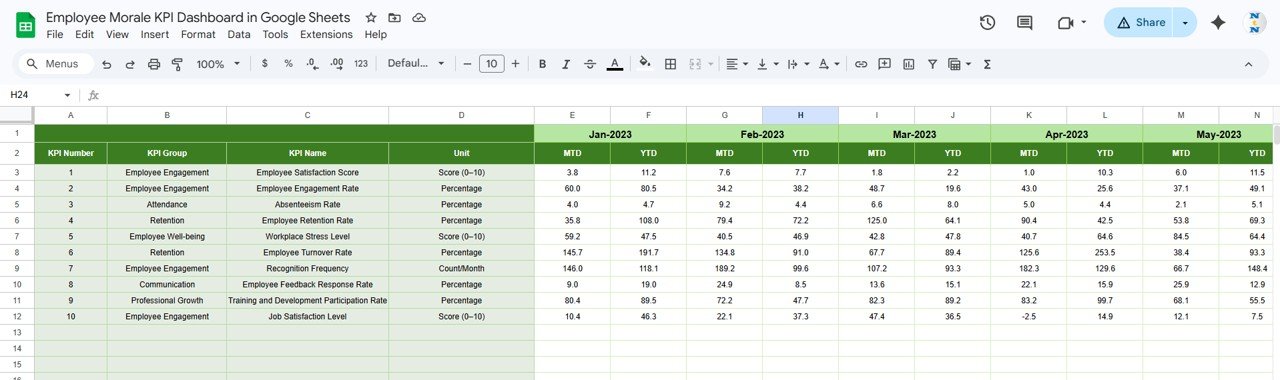
Previous Year Number Sheet – Historical KPI Comparison
The Previous Year Number Sheet stores historical KPI data.
Users must enter the KPI numbers for the previous year in the same structure as the current year.
This sheet allows organizations to compare current performance with historical performance.
As a result, HR managers can evaluate whether employee morale is improving or declining.
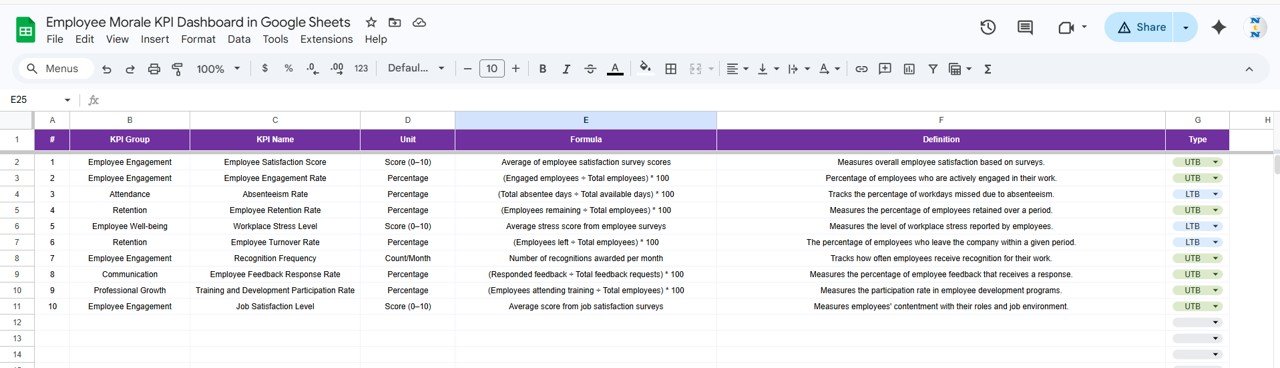
KPI Definition Sheet – Define KPI Framework
The KPI Definition Sheet contains the complete framework of the KPI system.
Users must enter the following details:
- KPI Name
- KPI Group
- Unit of Measurement
- KPI Formula
- KPI Definition
- KPI Type (Lower the Better or Upper the Better)
Because of this structured definition system, organizations can maintain consistent KPI reporting.
Click to Buy Employee Morale KPI Dashboard in Google Sheets
Advantages of Employee Morale KPI Dashboard in Google Sheets
Organizations gain several benefits by implementing an employee morale dashboard.
Centralized HR Analytics
HR teams can monitor all employee morale metrics in a single dashboard.
Better Workforce Insights
Managers can easily understand employee satisfaction and engagement trends.
Faster Decision-Making
Visual indicators and charts simplify performance analysis.
Improved Employee Retention
Organizations can detect morale issues early and take corrective action.
Easy Collaboration
Because Google Sheets operates in the cloud, teams can collaborate easily.
Best Practices for the Employee Morale KPI Dashboard
Click to Buy Employee Morale KPI Dashboard in Google Sheets
Organizations should follow several best practices to maximize the dashboard’s value.
Define Clear KPIs
HR teams must clearly define each KPI, including formulas and targets.
Collect Data Regularly
Organizations should update KPI data monthly or quarterly.
Monitor Trends Continuously
HR managers should analyze KPI trends to detect early warning signs.
Focus on Employee Feedback
Employee surveys provide valuable insights into morale.
Align KPIs with HR Strategy
Organizations should track KPIs that directly impact employee engagement and productivity.
Who Can Use the Employee Morale KPI Dashboard?
Many professionals can benefit from this dashboard.
Examples include:
- HR Managers
- HR Analysts
- Workforce Planning Teams
- Organizational Development Specialists
- Business Leaders
- HR Consultants
Any organization focused on improving employee engagement can use this dashboard.
Conclusion
Click to Buy Employee Morale KPI Dashboard in Google Sheets
The Employee Morale KPI Dashboard in Google Sheets provides an effective solution for monitoring employee engagement, satisfaction, and workplace performance.
Instead of analyzing scattered HR reports, organizations can track morale metrics through a centralized and interactive dashboard.
Moreover, the dashboard helps HR teams compare targets with actual performance, analyze historical trends, and identify areas that require improvement.
Because it uses Google Sheets, organizations can easily maintain and update the data without complex technical tools.
Therefore, companies that implement employee morale dashboards gain better workforce insights, improve employee satisfaction, and create a stronger organizational culture.
Visit our YouTube channel to learn step-by-step video tutorials
Youtube.com/@NeotechNavigators
Watch the step-by-step video tutorial: