Recruitment plays a critical role in the success of every organization. Companies must attract qualified candidates, evaluate them efficiently, and hire the right talent to support business growth. However, many HR teams struggle to track recruitment performance because hiring data often exists in scattered spreadsheets and manual reports.
As a result, recruitment managers find it difficult to analyze hiring efficiency, identify bottlenecks in the recruitment funnel, and measure hiring performance against targets.
Therefore, organizations increasingly use data-driven recruitment dashboards to monitor hiring performance and streamline recruitment operations.
One powerful solution is the Recruitment Funnel KPI Dashboard in Google Sheets. This ready-to-use dashboard helps HR teams monitor recruitment metrics, analyze hiring funnel performance, and track recruitment KPIs using dynamic and interactive visual reports.
In this article, you will learn everything about the Recruitment Funnel KPI Dashboard in Google Sheets, including its structure, features, advantages, best practices, and frequently asked questions.
What Is a Recruitment Funnel KPI Dashboard in Google Sheets?
Click to Buy Recruitment Funnel KPI Dashboard in Google Sheets
A Recruitment Funnel KPI Dashboard in Google Sheets is an analytical reporting tool designed to monitor and evaluate recruitment performance using key performance indicators (KPIs).
This dashboard tracks the entire recruitment funnel, from candidate sourcing to final hiring decisions.
The recruitment funnel typically includes stages such as:
- Job application submissions
- Candidate screening
- Interview stages
- Offer acceptance
- Final hiring
By analyzing these stages, HR teams can measure recruitment effectiveness and improve hiring strategies.
Moreover, the dashboard displays actual performance, targets, and previous year results, allowing HR managers to compare hiring outcomes over time.
Because the dashboard uses Google Sheets, teams can collaborate easily, update recruitment data in real time, and access performance insights from anywhere.
Why Do Organizations Need a Recruitment KPI Dashboard?
Click to Buy Recruitment Funnel KPI Dashboard in Google Sheets
Recruitment involves multiple processes, stakeholders, and data points. Without a structured reporting system, HR teams often face several challenges.
For example:
- Difficulty tracking candidate progress
- Limited visibility into recruitment performance
- Slow reporting processes
- Lack of data-driven hiring decisions
However, a recruitment KPI dashboard solves these problems.
When HR teams use a structured dashboard, they can:
- Monitor hiring performance easily
- Identify recruitment bottlenecks quickly
- Improve hiring efficiency
- Make better talent acquisition decisions
Therefore, a Recruitment Funnel KPI Dashboard becomes an essential tool for modern HR teams.
Key Features of the Recruitment Funnel KPI Dashboard in Google Sheets
The Recruitment Funnel KPI Dashboard in Google Sheets includes multiple worksheets that organize recruitment data and analytics efficiently.
This dashboard contains six worksheets, each designed to support recruitment performance tracking.
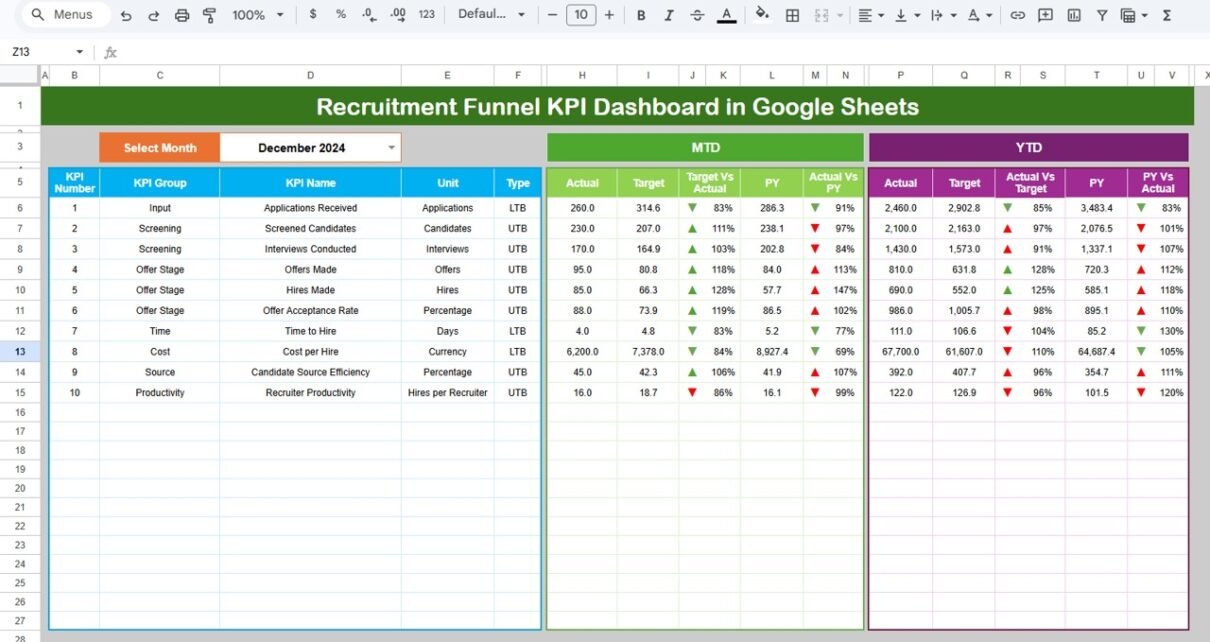
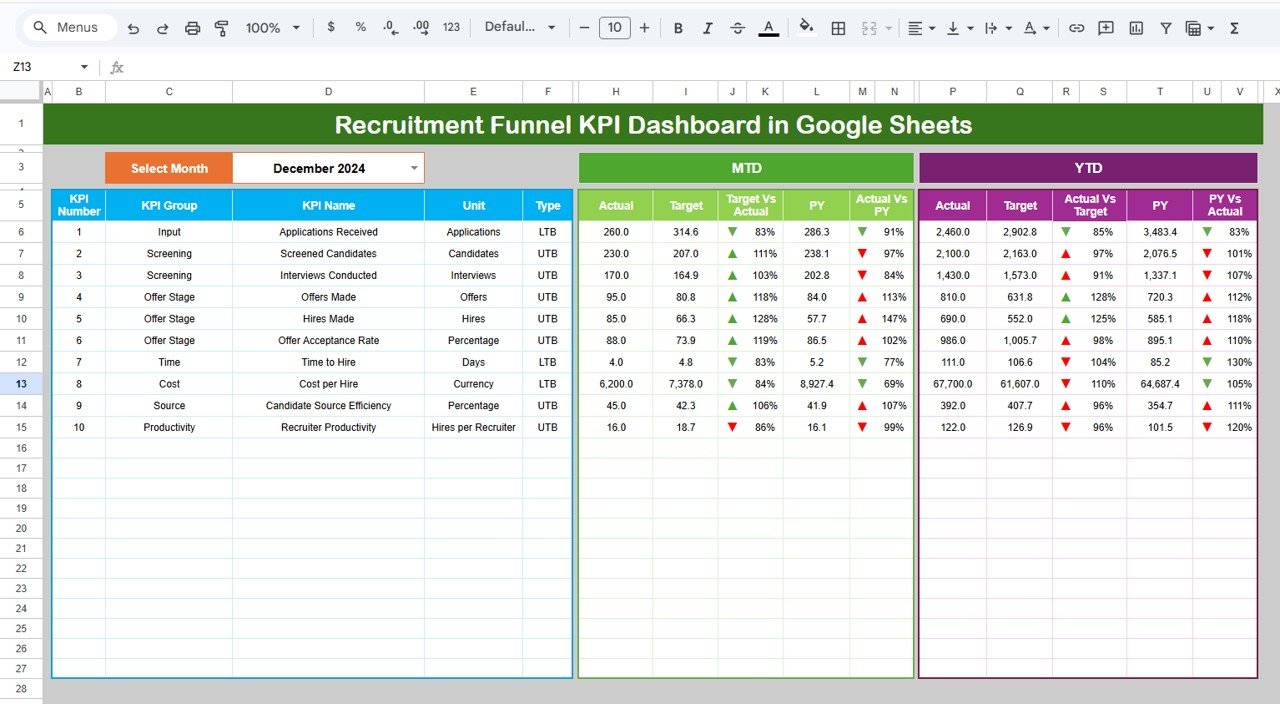
1. Dashboard Sheet – Main Recruitment KPI Overview
The Dashboard Sheet acts as the central interface of the recruitment KPI dashboard.
Here, users can view all recruitment performance indicators in a single screen.
Key Features of the Dashboard Sheet
Month Selection Dropdown
Users can select the month from the dropdown menu located in cell D3.
Once the month changes, the entire dashboard updates automatically.
MTD Performance Metrics
The dashboard displays Month-to-Date (MTD) values for each KPI, including:
-
Actual performance
-
Target performance
-
Previous year performance
Additionally, the dashboard compares:
-
Target vs Actual
-
Previous Year vs Actual
Conditional formatting arrows visually indicate performance trends.
For example:
-
▲ Up arrow indicates improvement
-
▼ Down arrow indicates decline
YTD Performance Metrics
The dashboard also displays Year-to-Date (YTD) values.
These metrics include:
-
YTD Actual
-
YTD Target
-
YTD Previous Year
As a result, HR teams can analyze recruitment performance across the entire year.
Visual Performance Indicators
Color-coded formatting helps HR managers quickly understand recruitment performance.
For example:
-
Green indicates good performance
-
Yellow indicates moderate performance
-
Red indicates performance below target
Therefore, the dashboard allows users to interpret recruitment results instantly.
Click to Buy Recruitment Funnel KPI Dashboard in Google Sheets
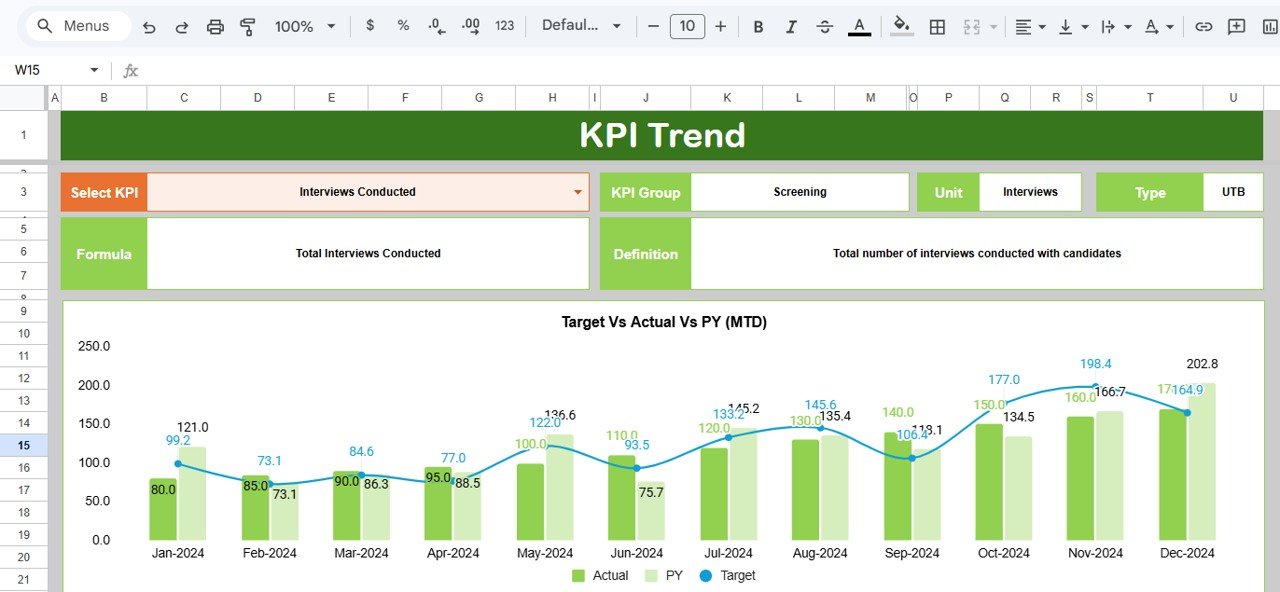
2. KPI Trend Sheet – Recruitment KPI Trend Analysis
The KPI Trend Sheet helps HR professionals analyze how recruitment performance changes over time.
Instead of reviewing raw numbers, users can analyze visual trend charts.
How the KPI Trend Sheet Works
Users select the KPI name from a dropdown menu in cell C3.
Once selected, the sheet displays detailed KPI information, including:
-
KPI Group
-
KPI Unit
-
KPI Type (Lower the Better or Upper the Better)
-
KPI Formula
-
KPI Definition
In addition, the sheet displays trend charts for:
-
Actual values
-
Target values
-
Previous year values
Both MTD and YTD trends appear in the charts.
As a result, HR teams can evaluate recruitment performance trends quickly.
Click to Buy Recruitment Funnel KPI Dashboard in Google Sheets
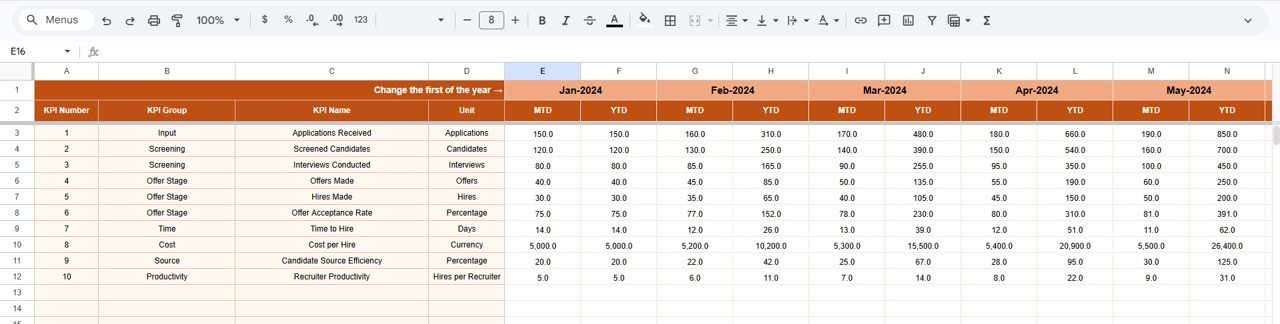
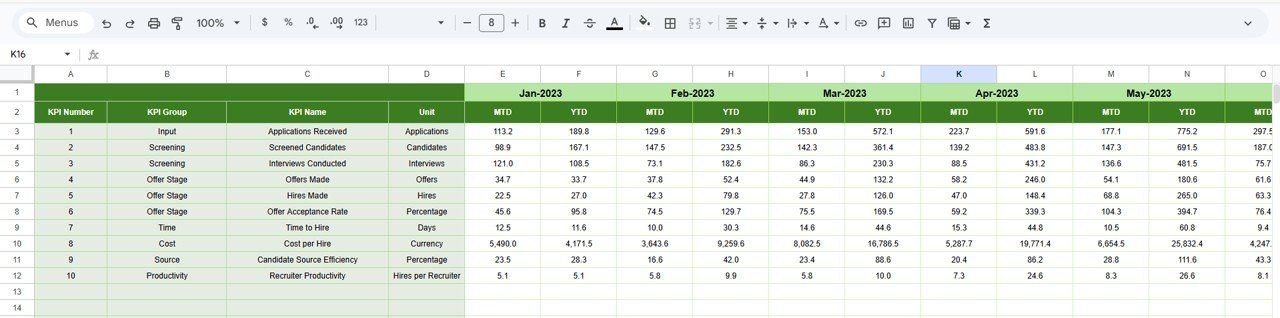
3. Actual Numbers Sheet – Recruitment Data Entry
The Actual Numbers Sheet stores actual recruitment results for each KPI.
HR teams enter recruitment performance data in this sheet.
How This Sheet Works
Users enter:
-
MTD actual numbers
-
YTD actual numbers
The sheet includes a month control cell in E1.
Users enter the first month of the year in cell E1, and the sheet automatically adjusts calculations accordingly.
Because this sheet serves as the primary data source, the dashboard updates automatically whenever users enter new data.
Click to Buy Recruitment Funnel KPI Dashboard in Google Sheets
4. Target Sheet – Recruitment KPI Targets
The Target Sheet stores target values for each recruitment KPI.
HR managers define performance goals for each KPI on a monthly basis.
Data Stored in the Target Sheet
The sheet includes:
-
KPI targets for MTD
-
KPI targets for YTD
These targets allow HR teams to measure recruitment performance against predefined goals.
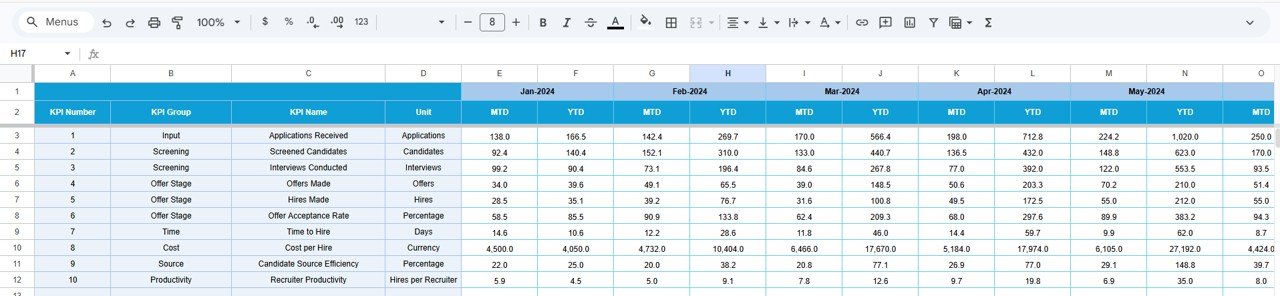
5. Previous Year Numbers Sheet – Historical Performance Data
The Previous Year Numbers Sheet contains recruitment performance data from the previous year.
This sheet helps HR teams compare current recruitment performance with historical results.
Benefits of Tracking Previous Year Data
When HR teams analyze previous year data, they can:
-
Evaluate hiring improvements
-
Identify long-term recruitment trends
-
Understand seasonal hiring patterns
Therefore, this sheet supports strategic recruitment planning.
Click to Buy Recruitment Funnel KPI Dashboard in Google Sheets
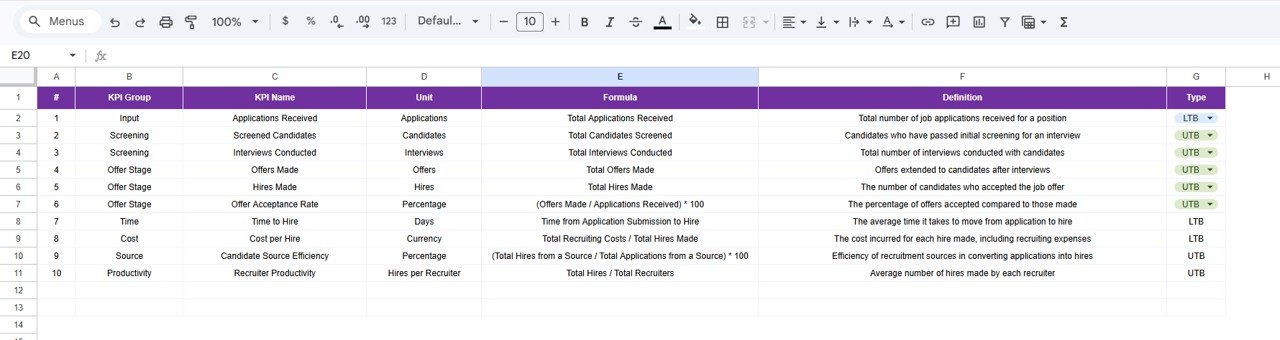
6. KPI Definition Sheet – KPI Reference Information
The KPI Definition Sheet acts as the documentation section of the dashboard.
This sheet defines each KPI clearly so that all users understand its purpose.
Information Stored in the KPI Definition Sheet
The sheet contains:
-
KPI Name
-
KPI Group
-
Unit of Measurement
-
KPI Formula
-
KPI Definition
Because this sheet explains each KPI, it ensures consistent KPI interpretation across the organization
Click to Buy Recruitment Funnel KPI Dashboard in Google Sheets
Advantages of Recruitment Funnel KPI Dashboard in Google Sheets
Using a recruitment KPI dashboard provides many benefits.
1. Improved Recruitment Visibility
The dashboard provides a clear overview of recruitment performance.
HR managers can easily track hiring progress.
2. Faster Hiring Decisions
Data-driven insights help HR teams make faster hiring decisions.
3. Better Candidate Funnel Analysis
The dashboard reveals where candidates drop out of the recruitment funnel.
Therefore, teams can improve hiring processes.
4. Real-Time Recruitment Reporting
Google Sheets allows users to update data instantly.
As a result, recruitment reports remain current.
5. Enhanced HR Collaboration
Because Google Sheets supports cloud collaboration, HR teams can work together seamlessly.
6. Easy Customization
Organizations can customize KPIs according to their recruitment strategy.
Best Practices for the Recruitment Funnel KPI Dashboard
Click to Buy Recruitment Funnel KPI Dashboard in Google Sheets
To maximize the effectiveness of the recruitment dashboard, HR teams should follow several best practices.
1. Define Clear Recruitment KPIs
Choose KPIs that directly reflect recruitment performance.
Avoid tracking unnecessary metrics.
2. Update Data Regularly
Update recruitment data frequently to ensure accurate insights.
For example:
-
After each hiring cycle
-
After interviews
-
After offer acceptance
3. Align KPIs with Business Goals
Recruitment KPIs should support organizational objectives.
For example:
-
Reduce time-to-hire
-
Improve candidate quality
4. Use Conditional Formatting Wisely
Visual indicators make data easier to interpret.
Therefore, use color coding and arrows effectively.
5. Review Recruitment Performance Monthly
Monthly reviews help HR teams identify problems quickly.
6. Train HR Teams to Use the Dashboard
Ensure that HR professionals understand how to enter and analyze data.
Conclusion
Click to Buy Recruitment Funnel KPI Dashboard in Google Sheets
The Recruitment Funnel KPI Dashboard in Google Sheets provides a powerful solution for tracking hiring performance and analyzing recruitment funnel efficiency.
Because the dashboard includes Dashboard, KPI Trend, Actual Numbers, Target, Previous Year, and KPI Definition sheets, HR teams can manage recruitment analytics effectively.
Moreover, the dashboard displays MTD and YTD performance comparisons, visual indicators, and trend charts, making recruitment data easier to interpret.
As a result, HR professionals can identify hiring challenges, improve recruitment processes, and make data-driven talent acquisition decisions.
Organizations that implement recruitment dashboards gain better visibility into hiring performance and build stronger recruitment strategies.
Visit our YouTube channel to learn step-by-step video tutorials
Youtube.com/@NeotechNavigators
Watch the step-by-step video tutorial:
Click to Buy Recruitment Funnel KPI Dashboard in Google Sheets