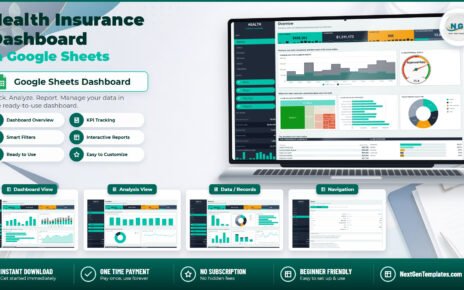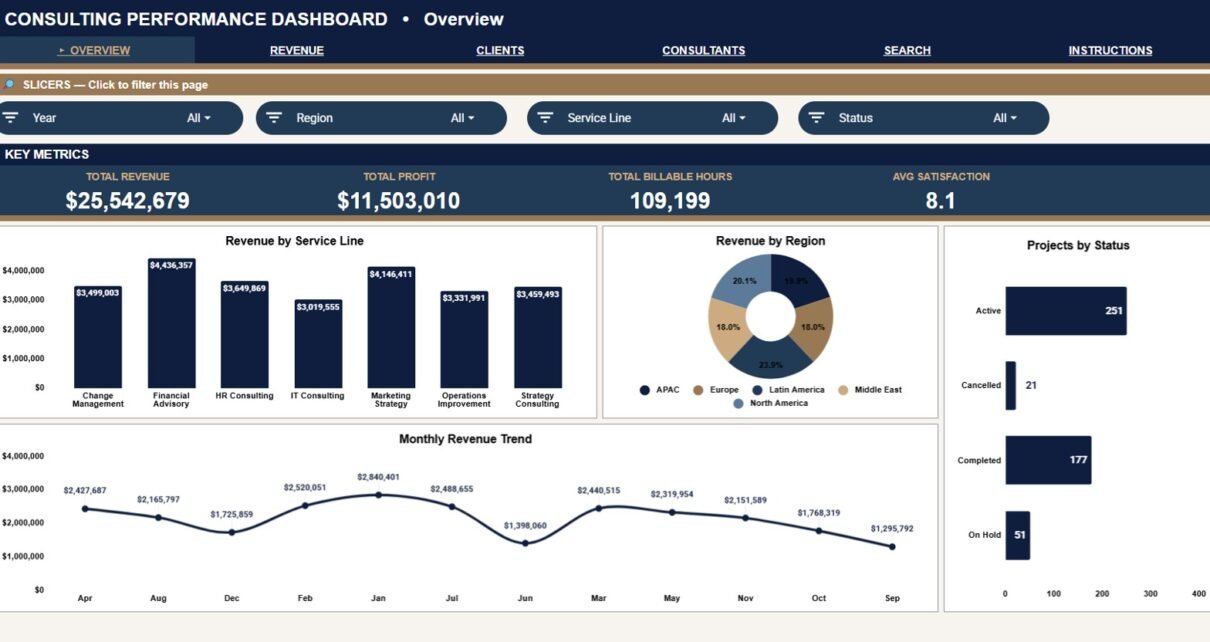
Consulting Performance Dashboard in Google Sheets is built for consulting partners, practice managers, finance teams, and operations leads who need a clear view of revenue, profit, billable hours, clients, consultants, service lines, project status, and satisfaction. The template includes 6 sheet tabs, 4 executive KPI cards, 16 chart views, multiple slicers, a Project ID lookup, and one structured Data Sheet. Instead of rebuilding reports every month or paying for a full PSA platform just to review performance, users can update the data table and review the dashboard inside Google Sheets.Consulting Performance Dashboard in Google Sheets
Get the Consulting Performance Dashboard in Google Sheets
Key Features of Consulting Performance Dashboard in Google Sheets
- 6 Google Sheets tabs covering Overview, Revenue & Profitability, Client Analysis, Consultant Performance, Search, and Data Sheet.
- 4 executive cards for Total Revenue, Total Profit, Total Billable Hours, and Avg Satisfaction.
- 16 chart views across revenue, cost, profit, region, industry, client, consultant, status, month, billable hours, and satisfaction.
- Multiple slicers that let users filter the dashboard quickly during partner meetings or monthly review calls.
- Project Lookup feature that returns the full record for a selected Project ID.
- Structured Data Sheet so new consulting project records can be added in the same format.
- Google Sheets format for sharing with partners, finance users, analysts, and delivery managers.
Dashboard Pages Explanation
The workbook is organized into focused pages so users can start with the executive summary and then move into profitability, client, consultant, search, and raw data views.
1. Overview Page
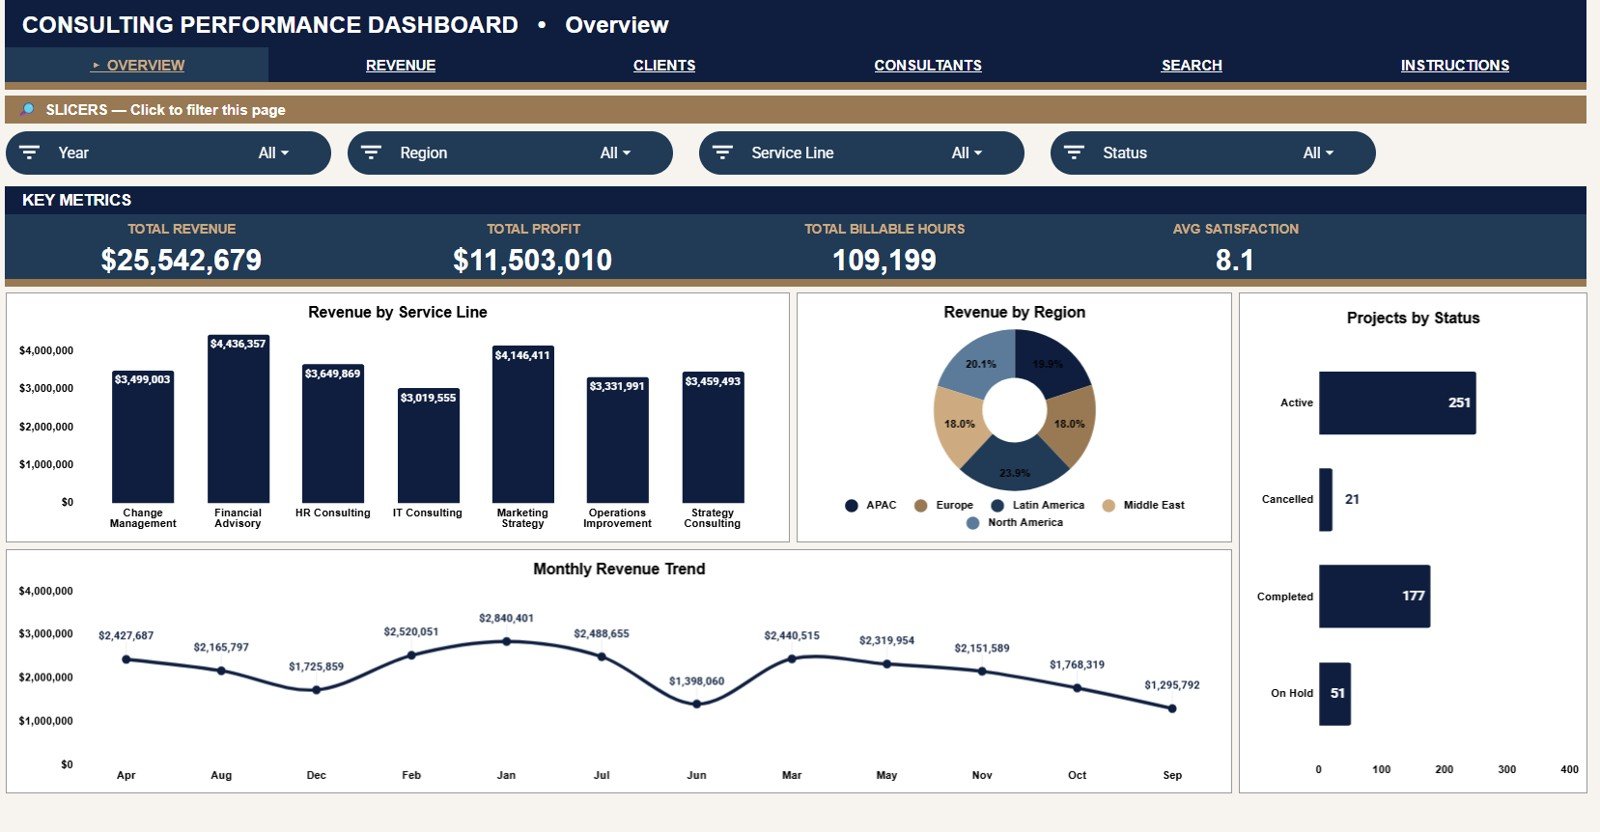
The Overview Page gives a high-level readout of consulting performance. The top cards show Total Revenue, Total Profit, Total Billable Hours, and Avg Satisfaction, which helps leaders check the health of the practice before opening deeper analysis tabs.
- Revenue by Service Line: Shows how much revenue each consulting service line contributes. This helps partners see which offerings are driving the practice and which may need pricing or sales attention.
- Revenue by Region: Compares revenue across regions. This helps users identify strong markets, weaker locations, and regional concentration.
- Projects by Status: Breaks projects by status so users can review active, completed, delayed, or on-hold work. This is useful for delivery follow-up and weekly project review.
- Revenue by Month: Tracks revenue over time. This helps users review monthly growth, seasonality, and periods that need pipeline support.
2. Revenue & Profitability
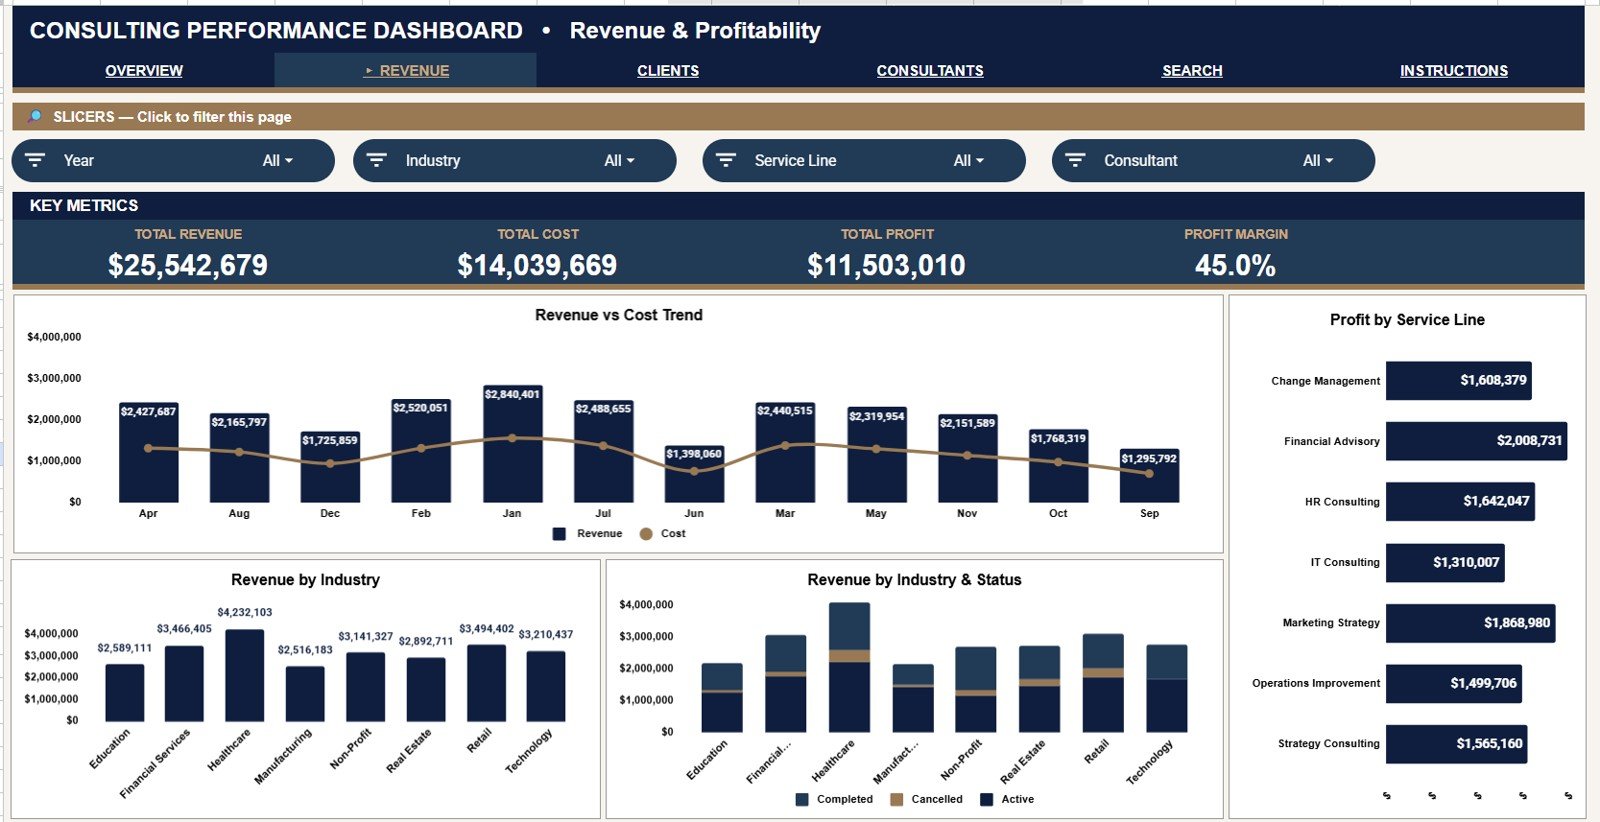
The Revenue & Profitability tab is for margin review. It helps consulting firms compare revenue, cost, profit, industry mix, and status combinations without creating a separate finance workbook.Consulting Performance Dashboard in Google Sheets
- Revenue and Cost by Month: Compares revenue with delivery cost by month. This helps users see whether revenue growth is translating into profitable work.Consulting Performance Dashboard in Google SheetsConsulting Performance Dashboard in Google Sheets
- Profit by Service Line: Shows which service lines contribute the most profit. This helps partners identify where to focus sales, delivery improvements, or pricing review.Consulting Performance Dashboard in Google Sheets
- Revenue by Industry: Shows revenue by client industry. This helps users understand whether the firm is concentrated in a few sectors or spread across markets.
- Revenue by Industry and Status: Combines industry and project status in one analysis. This helps teams see whether delayed or active work is clustered in a specific industry.
3. Client Analysis
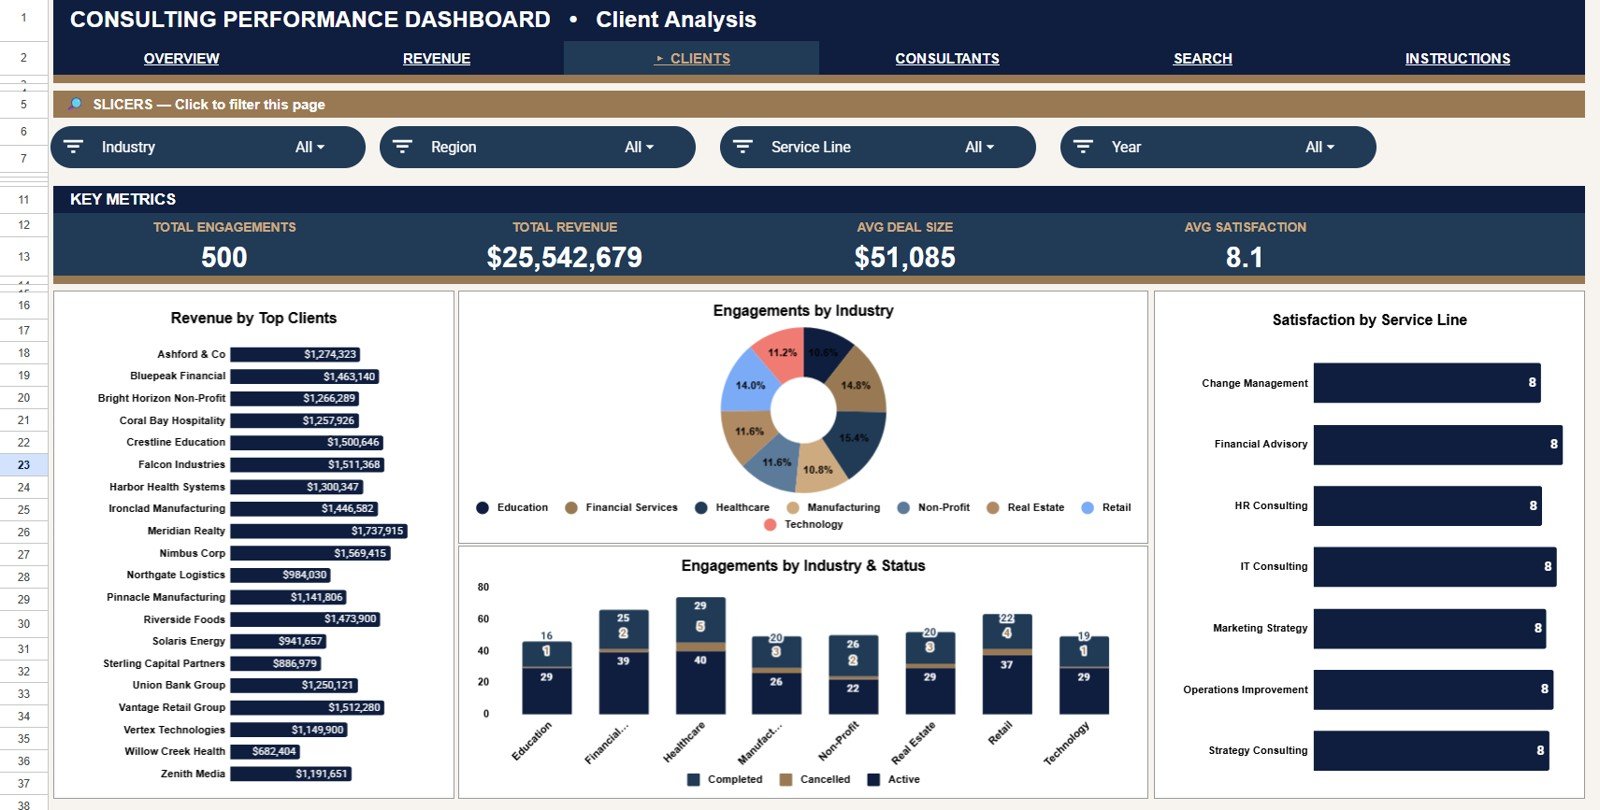
The Client Analysis tab helps users review account concentration, client mix, engagement volume, and satisfaction. It is useful for monthly account review and partner discussions.
- Revenue by Top Clients: Ranks the highest-revenue clients. This helps identify key accounts and client concentration risk.Consulting Performance Dashboard in Google Sheets
- Engagements by Industry: Counts engagement volume by industry. This shows where the firm is winning work, even when project size varies.Consulting Performance Dashboard in Google Sheets
- Satisfaction by Service Line: Compares average satisfaction across service lines. This helps connect client experience with service delivery.
- Engagements by Industry and Status: Combines industry and project status. This helps managers spot where active, completed, or delayed work is concentrated.Consulting Performance Dashboard in Google SheetsConsulting Performance Dashboard in Google Sheets
4. Consultant Performance
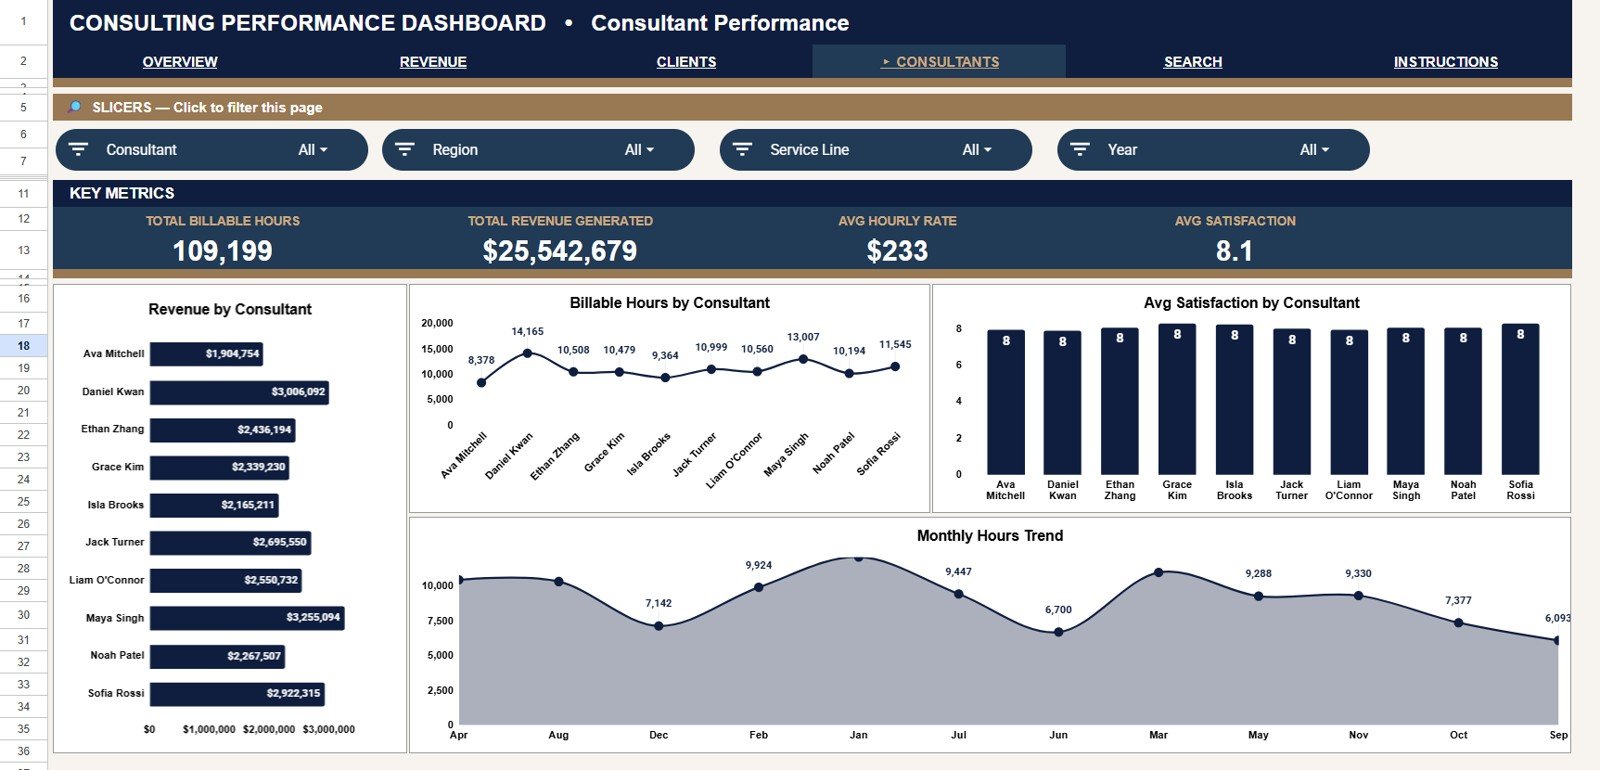
The Consultant Performance tab is built for delivery, workload, and satisfaction review. It gives managers a practical way to compare revenue contribution, billable hours, and client satisfaction by consultant.
- Revenue by Consultant: Shows revenue tied to each consultant. This helps leaders review contribution across the delivery team.
- Billable Hours by Consultant: Compares billable hours by consultant. This helps identify workload imbalance, low utilization, or capacity pressure.
- Average Satisfaction by Consultant: Shows satisfaction by consultant. This helps managers review quality of delivery alongside revenue and hours.
- Billable Hours by Month: Tracks monthly billable hours. This helps with staffing decisions, demand planning, and monthly utilization review.
5. Search Sheet tab
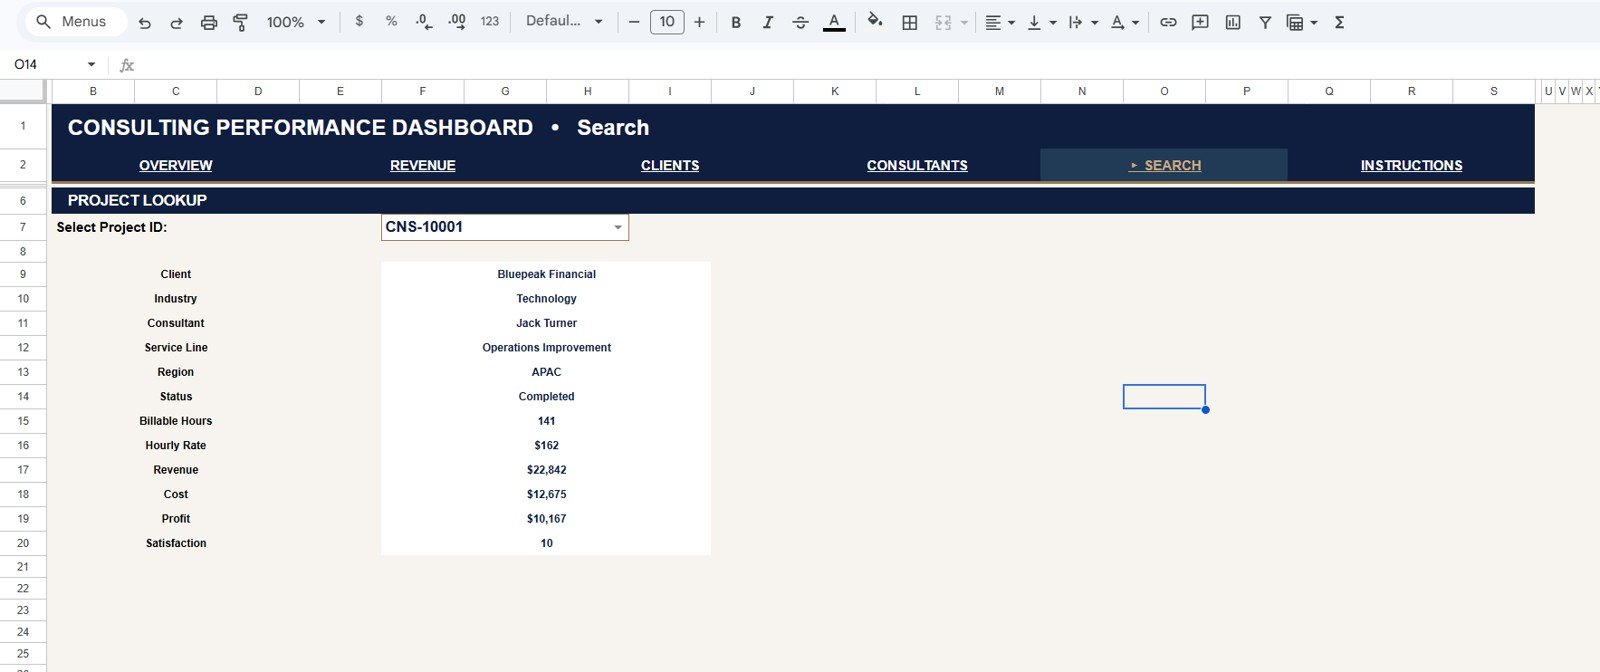
The Search tab includes a Project Lookup feature. Select a Project ID from the dropdown and instantly view Project ID, Client, Industry, Consultant, Service Line, Region, Status, Billable Hours, Hourly Rate, Revenue, Cost, Profit, and Satisfaction.
6. Data Sheet tab
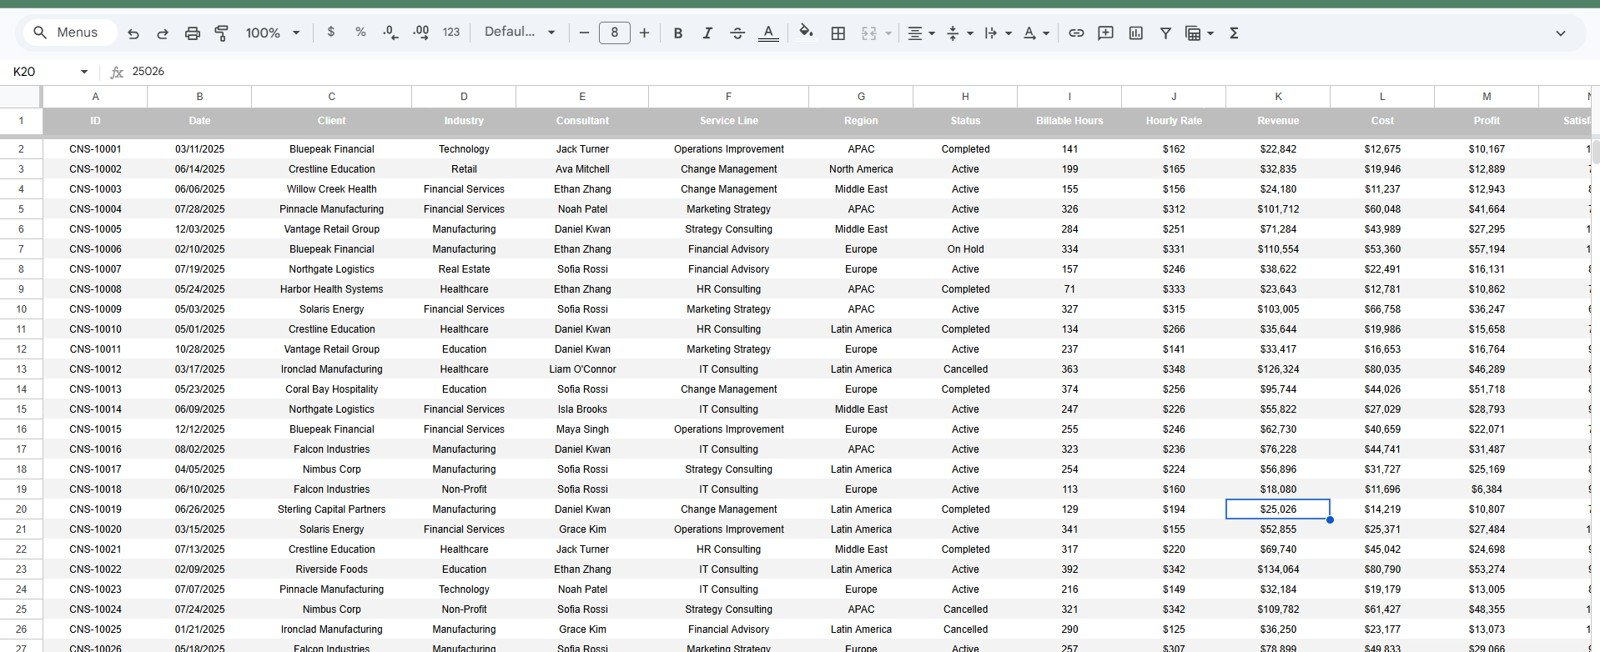
The Data Sheet is the input layer for the dashboard. Add consulting project data in the same format so all cards, slicers, charts, and the Project Lookup tab continue to work from one consistent table.
Consulting Performance Dashboard in Google Sheets vs. Microsoft Excel Dashboard vs. Paid PSA/CRM SaaS – Feature Comparison
| Feature | This Google Sheets dashboard | Microsoft Excel dashboard | Paid PSA/CRM SaaS |
|---|---|---|---|
| Cost | $9.99 one-time | Template cost plus possible Microsoft 365 license | Monthly or annual subscription |
| Platform | Google Sheets in browser | Excel desktop or web | Vendor cloud platform |
| Setup time | Copy file, replace sample data, review dashboard | Open workbook, replace data, refresh if needed | User setup, fields, workflows, and onboarding |
| Real-time team collaboration | Native Google Drive sharing | Requires OneDrive or SharePoint | Usually included, plan dependent |
| Mobile access | Google Sheets mobile app and browser | Excel mobile app, plan dependent | Vendor mobile app or browser portal |
| Customizable fields | Edit labels, formulas, charts, and columns | Edit workbook structure | Often limited by admin settings |
| Share with link | Yes, through Google Drive permissions | Yes, with Microsoft cloud storage | Often requires paid user seats |
| Year-1 cost at 5 users | $9.99 total template cost | Template plus license costs | Often hundreds or thousands per year |
| Project lookup | Built-in Project ID Search tab | Possible with formulas | Usually part of project records |
| Consultant performance | Revenue, hours, and satisfaction views | Possible with custom setup | Plan and setup dependent |
Who Should Use This Template
- Consulting partners who want a monthly view of revenue, profit, hours, and satisfaction.
- Practice managers who track service line, region, status, industry, and client mix.
- Operations leads who need consultant workload and billable hour visibility.
- Finance analysts who maintain project records in spreadsheets and want cleaner reporting.
- Solo consultants and boutique teams that need a shareable Google Sheets dashboard without buying PSA software.
Real-World Use Cases
Ava manages a boutique strategy firm. She uses the Overview page to compare revenue by region and service line before the monthly partner meeting. The Revenue by Month chart gives her a fast view of whether the pipeline is turning into billed work.
Nikhil runs delivery operations for an IT consulting team. He reviews Billable Hours by Consultant and Billable Hours by Month every Friday to check workload pressure and plan staffing for upcoming projects.
Morgan is an independent consultant. Morgan uses the Search tab before client calls, selects a Project ID, and quickly checks revenue, cost, profit, status, and satisfaction without scrolling through the Data Sheet.
Advantages of Consulting Performance Dashboard in Google Sheets
- Works in Google Sheets, so teams can collaborate through Google Drive.
- Combines financial, client, project, and consultant views in one workbook.
- Uses slicers for fast filtering during meetings.
- Includes a Project ID lookup for record-level review.
- Keeps the input data in one structured Data Sheet.
- One-time purchase keeps reporting cost predictable.
Opportunities for Improvement
- Automated time entry: Teams that use Harvest, Toggl, Clockify, or other time tools may want to add an import step or Google Apps Script connector.
- Invoice connection: This dashboard does not issue invoices, so finance teams may still export or paste billing data from accounting software.
- Role-based workflows: Google Sheets sharing works well for small teams, but larger firms may need PSA software for approvals and audit trails.
- Multi-year reporting: Users can extend the Data Sheet with year fields and add year-over-year views if needed.
Best Practices
Keep Project ID values unique so the Search tab always returns the correct record. Update the Data Sheet on a consistent schedule, ideally weekly or monthly, so revenue, hours, and satisfaction do not drift from reality.
Use consistent service line, industry, region, and status labels. Small spelling differences can split chart categories and make the dashboard harder to read.
Limit edit access to the people responsible for maintaining the data. Share view-only access with partners and stakeholders who only need the dashboard output.
If you extend formulas or add calculated fields, use the official Google Sheets function list as a reference.
Explore Relevant Templates
- Consulting Performance Dashboard in Google Sheets – the dashboard covered in this article.
- Accounting Firm Revenue Dashboard in Google Sheets – useful for professional services teams tracking fees, WIP, hours, and clients.
- Account Management KPI Dashboard in Google Sheets – track account KPIs, targets, and trends.
- Project Task Management Dashboard in Google Sheets – monitor project tasks, cost, progress, and contractors.
- Consulting Report in Excel – an Excel option for consulting project reporting.
If you want to get better at turning project data into dashboards like this, the Excel Pivot Tables & Dashboards course on NextGenTemplates Academy walks through the method with practice files.
Get the Consulting Performance Dashboard in Google Sheets
Frequently Asked Questions
Is the Consulting Performance Dashboard built in Google Sheets?
Yes. It is a Google Sheets dashboard template designed to be copied into your own Google Drive and edited from there.
What KPI cards are included on the Overview page?
The Overview page includes Total Revenue, Total Profit, Total Billable Hours, and Avg Satisfaction.
Can I search for a specific project?
Yes. The Search tab lets you select a Project ID and view the matching project details, including client, industry, consultant, service line, region, status, hours, rate, revenue, cost, profit, and satisfaction.
Does this replace PSA software?
No. It is a reporting dashboard for Google Sheets. It does not replace time tracking, invoicing, CRM workflows, resource management, or formal approvals.
Can I customize the charts and fields?
Yes. After copying the file to Google Drive, you can edit sheet labels, data columns, formulas, charts, slicers, and formatting.
Who is this best suited for?
It is best for small and mid-sized consulting teams, solo consultants, finance analysts, and practice managers who maintain project data in spreadsheets and need a visual dashboard.
About the Author
Built by PK – Microsoft Certified Professional with 15+ years of Excel, Google Sheets, and Power BI experience. Founder of NextGenTemplates, reaching 300K+ subscribers across YouTube channels. Every template is hand-built and tested before release.
Conclusion
The Consulting Performance Dashboard in Google Sheets gives consulting teams a practical way to review revenue, profit, billable hours, clients, service lines, regions, project status, consultants, and satisfaction in one editable workbook. With 6 tabs, 4 KPI cards, 16 chart views, slicers, a Project ID lookup, and a structured Data Sheet, it sits between a basic spreadsheet and a paid PSA platform.
Last updated: July 9, 2026.