The U.S. Bureau of Labor Statistics projects about 20,000 graphic designer openings each year from 2024 to 2034, while overall graphic designer employment is projected to grow 2 percent. For design studios, creative agencies, freelancers, and in-house teams, that means the work pipeline still needs careful tracking across revenue, hours, clients, revisions, and delivery quality. The Graphic Design Studio Dashboard in Google Sheets gives teams an editable workbook for reviewing design performance without starting from a blank spreadsheet.Graphic Design Studio Dashboard in Google Sheets
This template is built for Google Sheets, so it is easy to share with teammates, update from any browser, and adjust as your studio process changes. It works especially well when you want a clean view of project value, service mix, designer workload, client profitability, and delivery status in one place. Source: U.S. Bureau of Labor Statistics, Graphic Designers Occupational Outlook Handbook.
Get the Graphic Design Studio Dashboard in Google Sheets to start organizing project, client, and design team metrics in a ready-made format.
Key Features of Graphic Design Studio Dashboard in Google Sheets
Graphic Design Studio Dashboard in Google Sheets
- Overview dashboard: View total revenue, total projects, hours logged, designers, clients, services, average client rating, and average deal size.Graphic Design Studio Dashboard in Google Sheets
- Service analysis: Compare revenue, hours, revisions, and monthly performance by service type.
- Creative team view: Track revenue, projects, revisions, and designer contribution by team member.
- Client portfolio view: Review revenue, profit, profit margin, and largest project value by client.
- Delivery desk: Monitor status, ratings, delivery quality, and services with the most revisions.
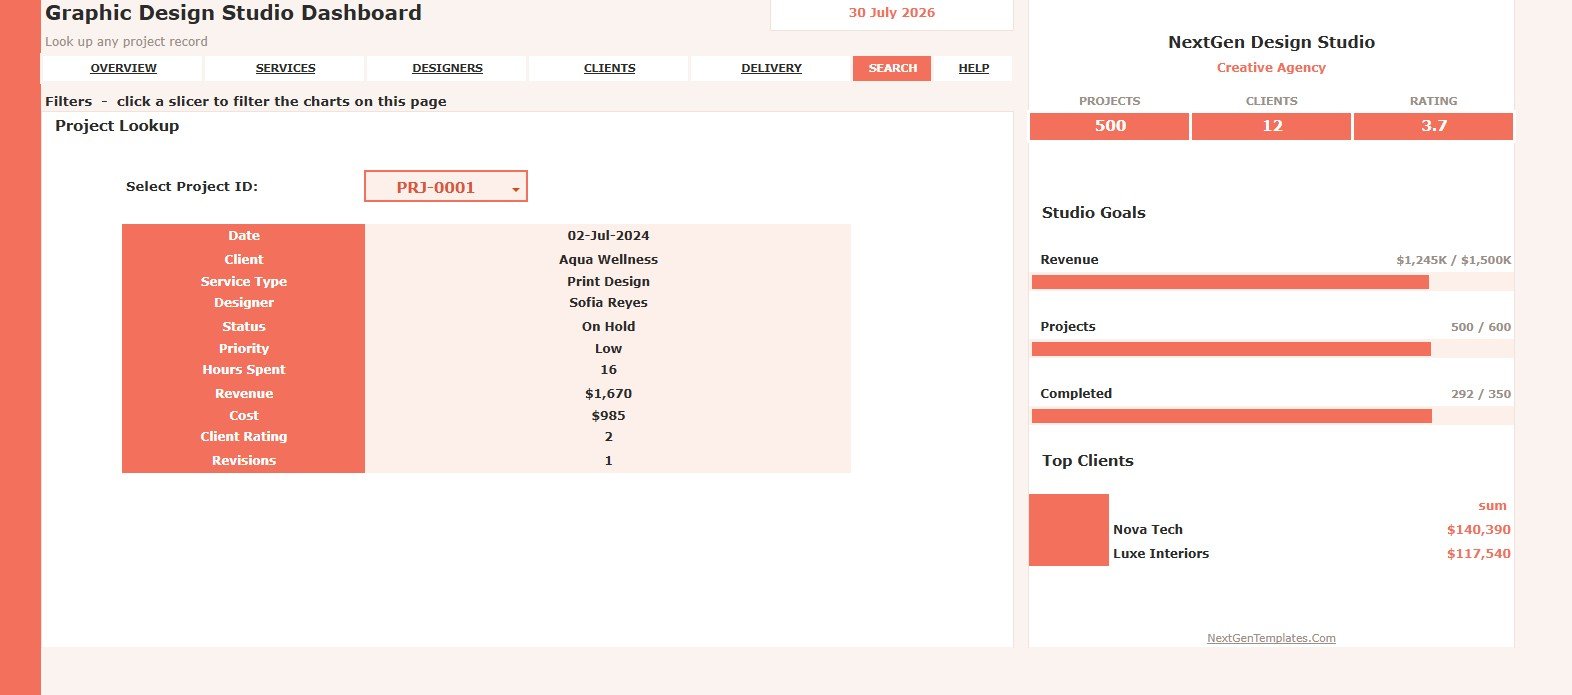
- Search tab: Select a Project ID and instantly view the matching project details.
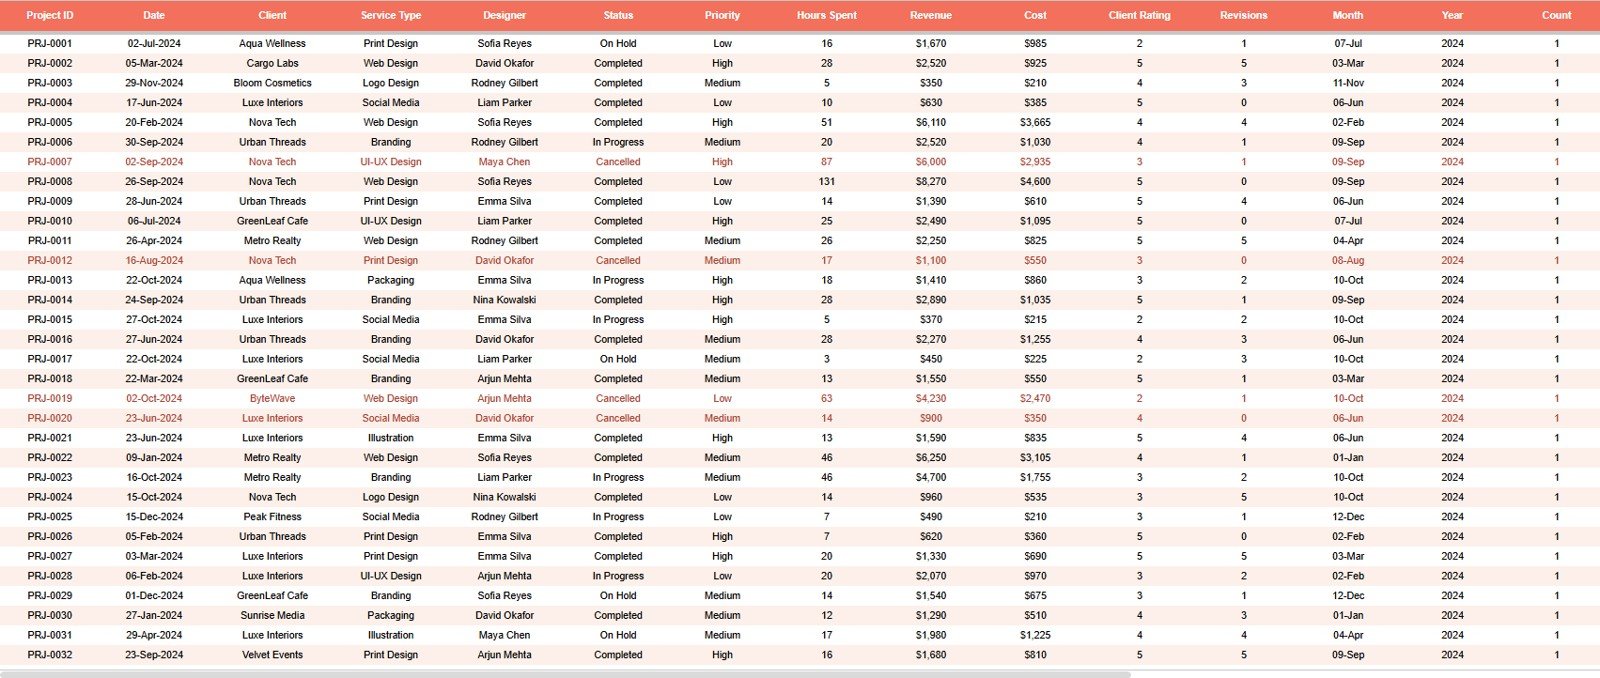
- Data sheet: Enter or paste studio project data in the same format used by the dashboard.
- Google Sheets format: Share, duplicate, and customize the workbook inside Google Drive.Graphic Design Studio Dashboard in Google Sheets
Dashboard Pages Explanation
Overview Page
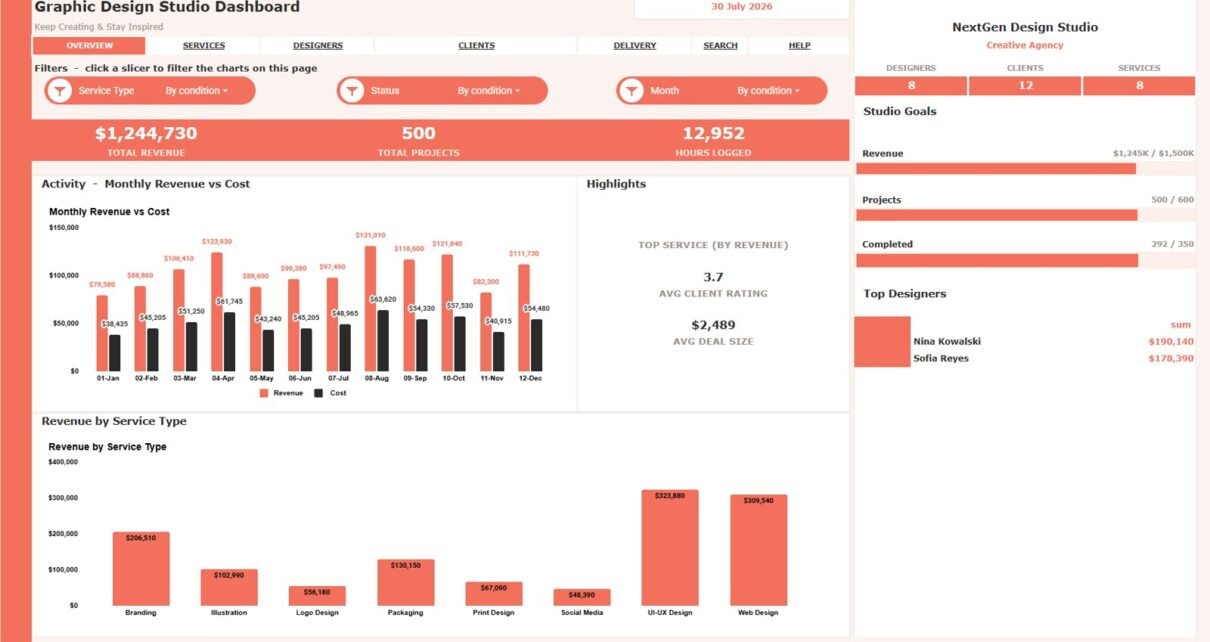
The Overview Page gives studio owners and managers a high-level performance snapshot. The top KPI cards show Total Revenue, Total Projects, Hours Logged, Designers, Clients, Services, Avg Client Rating, and Avg Deal Size.Graphic Design Studio Dashboard in Google Sheets
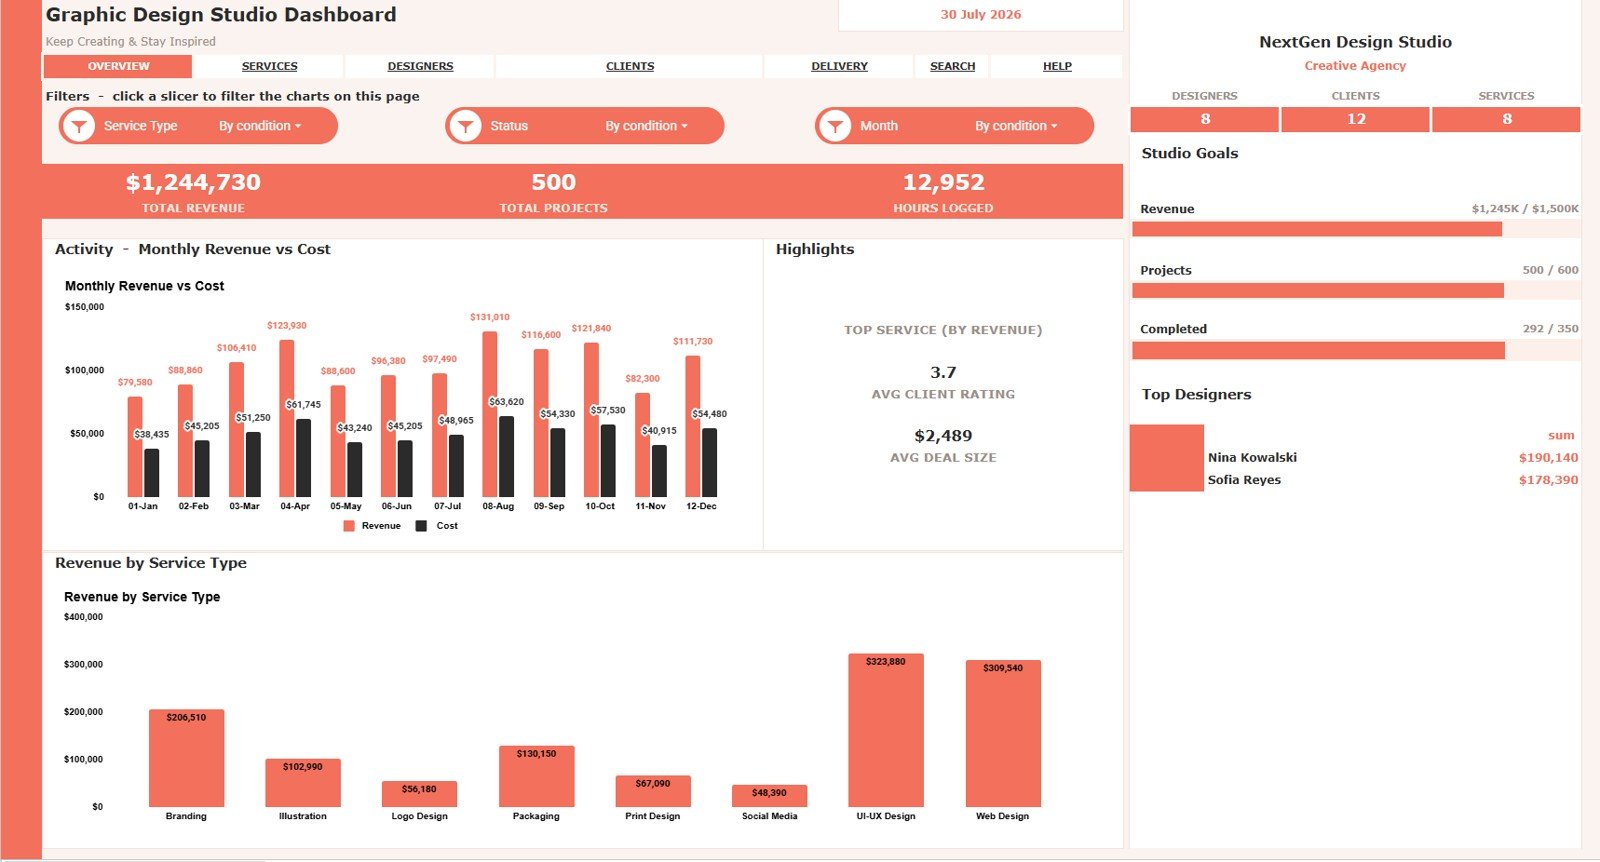
- Monthly Revenue and Cost by Month: This chart compares income and delivery cost across each month. It helps you see whether growth is coming with healthy cost control or rising production expense.
- Revenue by Service Type: This chart shows which services generate the most revenue for the studio. Use it to understand whether branding, social media design, web design, or other services are leading your sales mix.Graphic Design Studio Dashboard in Google Sheets
- Top Designer Revenue by Designer: This chart ranks designers by revenue contribution. It helps managers review workload impact, recognize top performers, and balance future assignments more fairly.Graphic Design Studio Dashboard in Google Sheets
- Studio Goal Progress by Goal: This chart tracks progress against studio goals. It gives leadership a quick way to compare revenue, delivery, client, or productivity targets against actual results.
Service Studio
The Service Studio tab focuses on the performance of each design service. It is useful when you want to know which service lines bring revenue, consume hours, or require more revisions.
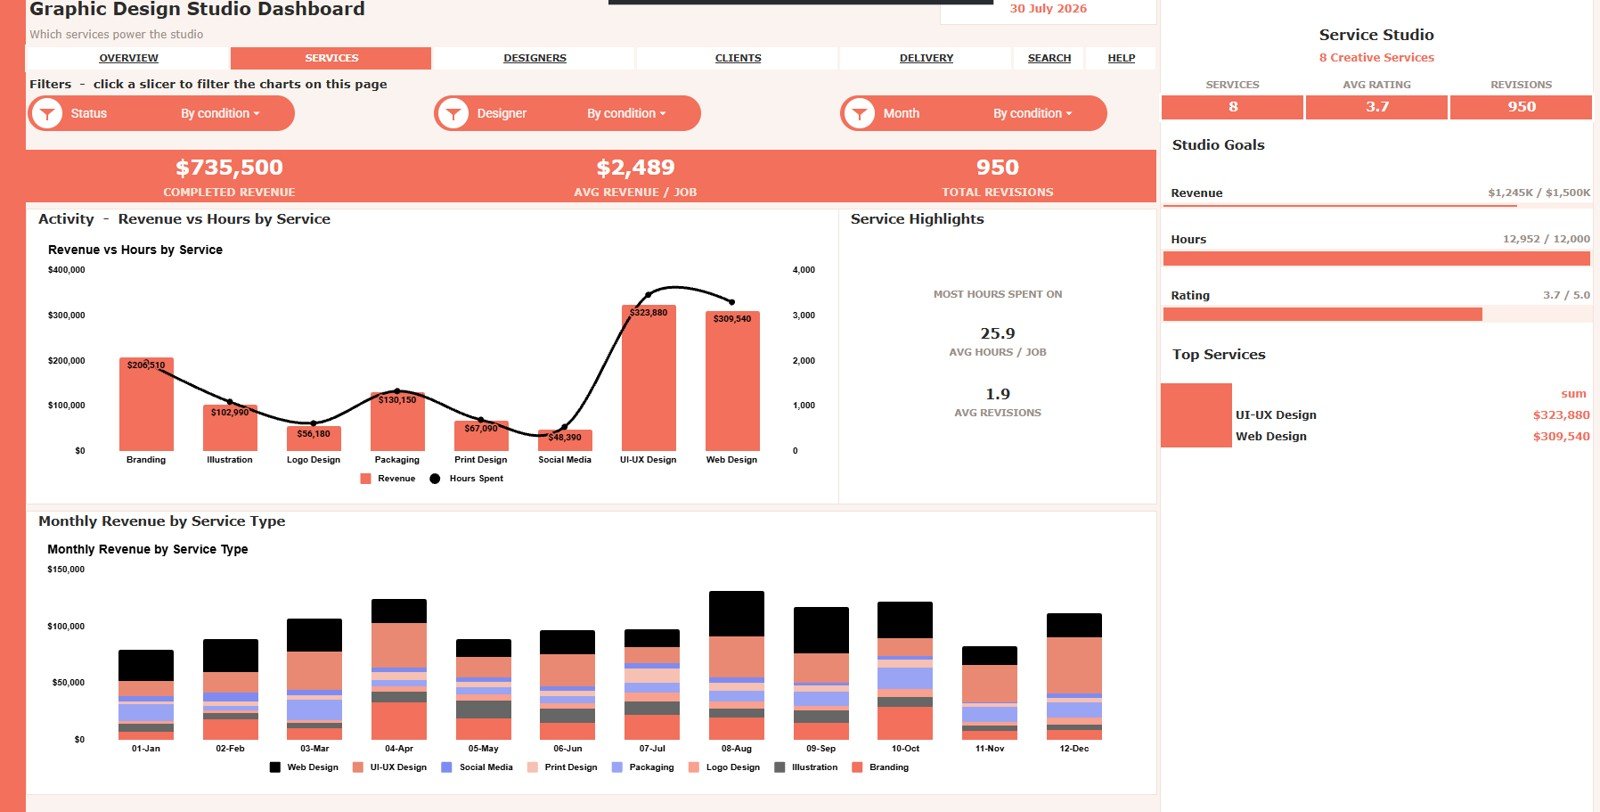
- Revenue and Hours by Service: This chart compares money earned with time invested for each service. It helps identify services that look busy but may not be efficient.
- Monthly Revenue by Service Type: This chart shows how each service performs across months. It helps you spot seasonal service demand and campaign-driven revenue changes.
- Average Hours per Job by Service: This chart shows the typical time required for each service category. Use it to refine estimates, pricing, and delivery timelines.
- Average Revisions by Service: This chart highlights services that require more feedback rounds. It can reveal unclear briefs, quality issues, or services that need stronger approval workflows.
- Top Service Revenue by Service: This chart ranks services by total revenue. It helps prioritize offers that deserve more promotion, packaging, or team capacity.
Creative Team
The Creative Team tab helps review designer performance and project distribution. It is designed for teams that need visibility into contribution, workload, revisions, and project volume.
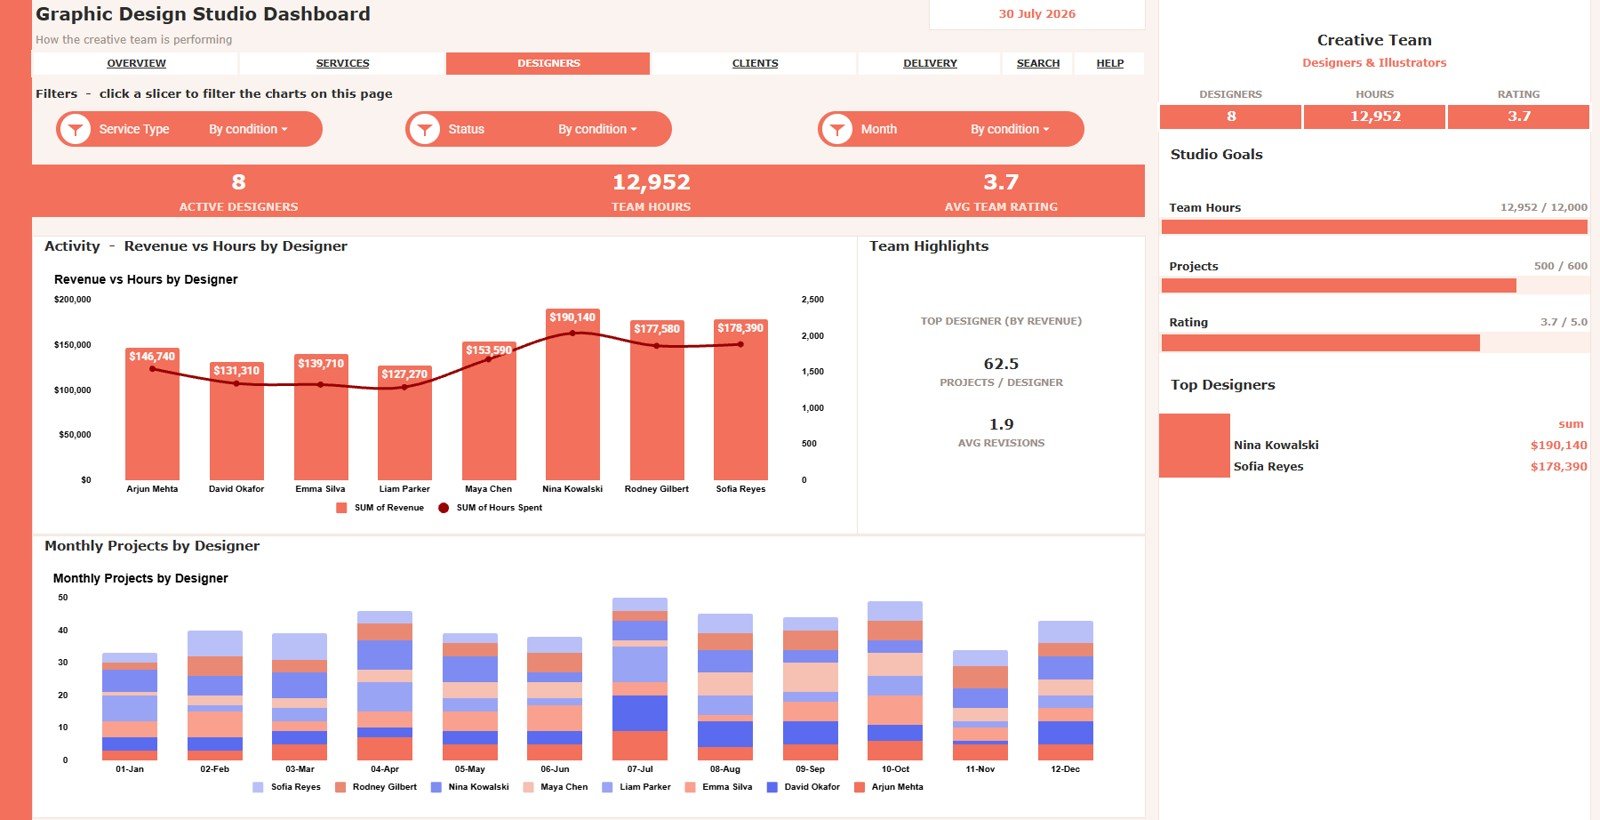
- Revenue and Hours by Designer: This chart compares each designer’s revenue with the time logged. It helps managers review productivity while still considering the effort needed for complex work.
- Monthly Projects by Designer: This chart shows project volume by designer across months. It helps identify overloaded team members and slower months where capacity can be reassigned.
- Projects per Designer by Designer: This chart ranks designers by project count. It is useful for checking whether project distribution is even across the creative team.
- Average Revisions by Designer: This chart shows the average number of revision rounds for each designer. It can support coaching, process changes, or closer brief review before work begins.
- Top Designer Revenue by Designer: This chart identifies designers connected to the highest revenue. It helps connect creative output with business value without hiding the need for fair workload planning.
Client Portfolio
The Client Portfolio tab shows which clients are creating the most value for the studio. It helps compare revenue, cost, profit, margin, and project size across client accounts.
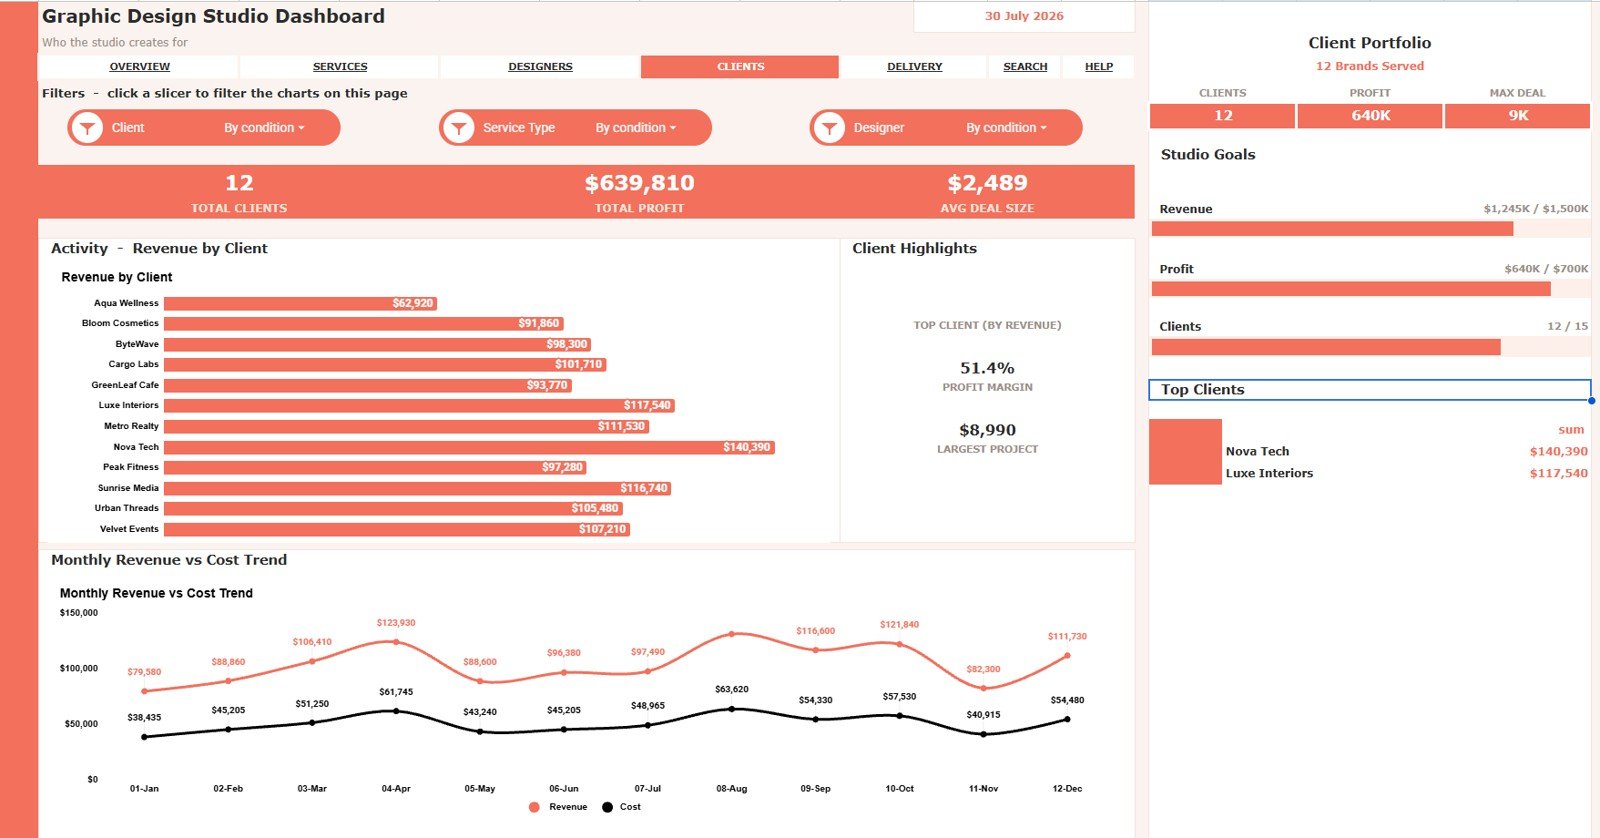
- Revenue by Client: This chart shows which clients generate the most studio revenue. It helps identify key accounts and clients that may need stronger retention efforts.
- Monthly Revenue and Cost by Month: This chart compares revenue and cost trends over time. It helps reveal whether profitability is improving or whether costs are rising faster than revenue.
- Profit by Client: This chart shows the profit contribution from each client. It helps teams avoid judging accounts by revenue alone when delivery cost is high.
- Profit Margin by Client Portfolio: This chart compares margin percentage by client. It is useful for pricing reviews, client renewal conversations, and project scoping decisions.
- Largest Project Value by Client: This chart identifies the biggest project value for each client. It helps managers spot accounts with larger upsell or repeat-project potential.
Delivery Desk
The Delivery Desk tab focuses on project status, quality, ratings, and revisions. It is the right page for reviewing operational health and spotting delivery friction before it becomes a client issue.
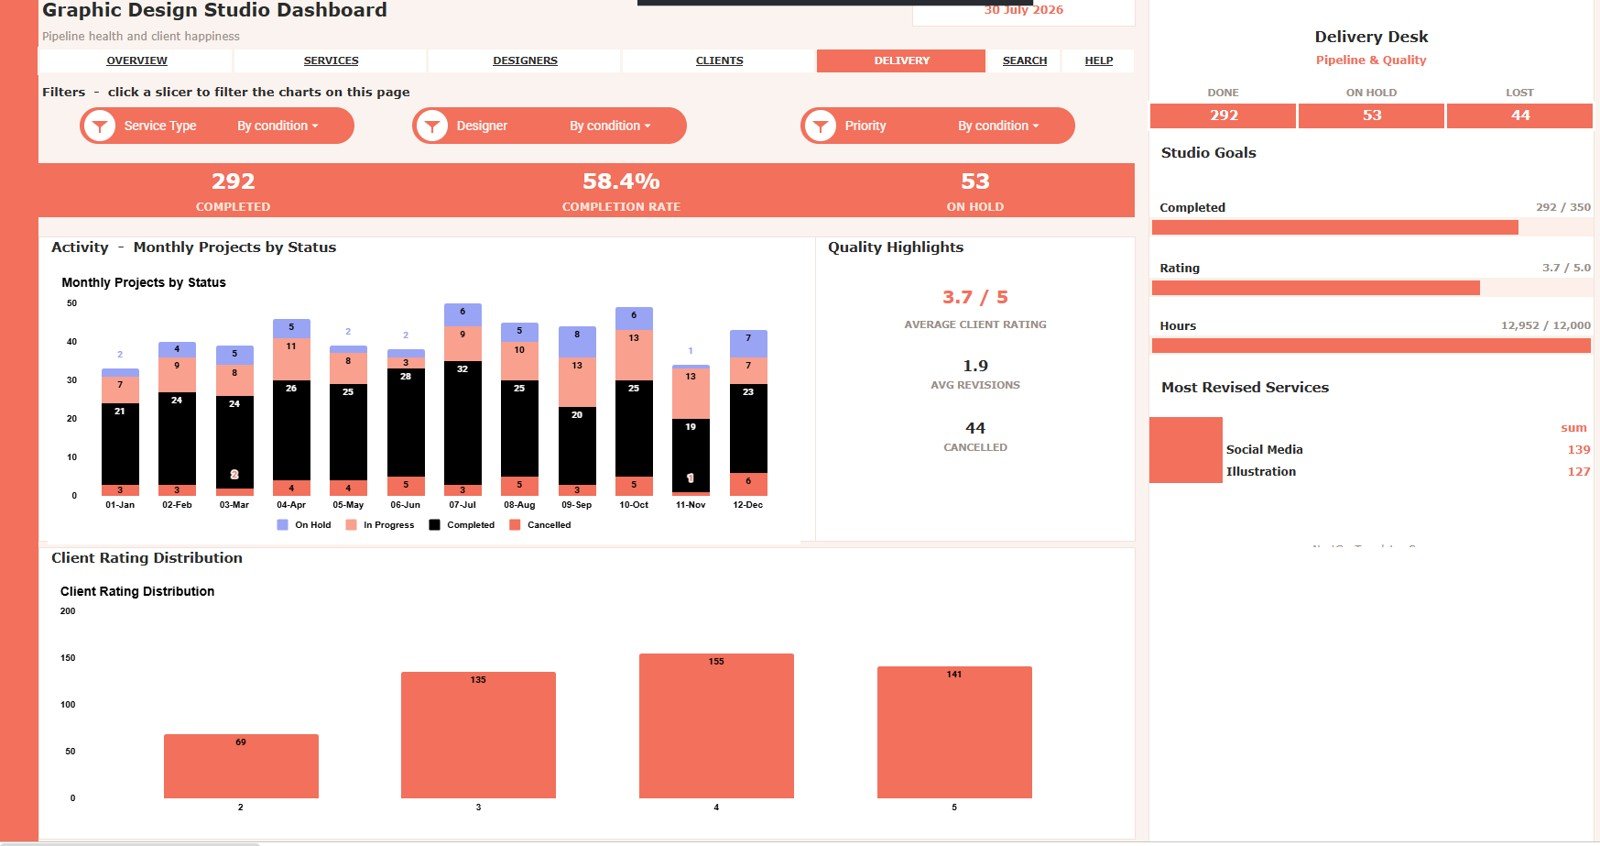
- Monthly Projects by Status: This chart shows how projects are distributed by status each month. It helps managers see whether work is moving through the studio or building up in specific stages.
- Client Rating Count by Rating: This chart counts projects by client rating score. It helps teams understand whether client satisfaction is clustered around high, mid, or low ratings.
- Average Client Rating by Delivery Quality: This chart connects client ratings with delivery quality labels. It helps show whether quality categories match real client feedback.
- Average Revisions by Delivery Quality: This chart compares revision rounds by delivery quality. It can reveal where quality problems are increasing rework and slowing delivery.
- Most Revised Services by Service: This chart shows which services require the highest revision activity. It helps refine service briefs, proofing steps, and client approval expectations.
Search Sheet Tab
The Search Sheet lets you select a Project ID and instantly view the matching project details. It can show date, client, service type, designer, status, priority, hours spent, revenue, cost, client rating, and revisions in one lookup area.
Data Sheet Tab
The Data Sheet is where you add your studio data in the same format used by the dashboard. Keeping this sheet clean and consistent helps all dashboard pages update correctly.
Graphic Design Studio Dashboard in Google Sheets vs. Microsoft Excel Dashboard vs. Paid CRM/SaaS – Feature Comparison
| Feature | Graphic Design Studio Dashboard in Google Sheets | Microsoft Excel Dashboard | Paid CRM/SaaS Alternative |
|---|---|---|---|
| Cost | One-time template purchase | May require Microsoft 365 | Monthly or annual subscription |
| Platform | Google Sheets in the browser | Excel desktop or web | Vendor-hosted app |
| Setup time | Copy the workbook and replace sample data | Download and adapt workbook | Account setup, imports, roles, and workflow settings |
| Real-time team collaboration | Native Google Sheets collaboration | Available with OneDrive or SharePoint | Usually available by user seat |
| Mobile access | Available through Google Sheets app or browser | Available through Excel app or browser | Usually available through web or mobile app |
| Customizable fields | Editable sheet structure | Editable workbook structure | Depends on plan and admin permissions |
| Share with link | Yes, using Google Drive sharing | Yes, when stored in cloud | Usually invite-based |
| Year-1 cost at 5 users | Template price only, excluding Google Workspace costs | Depends on Microsoft subscription | Often hundreds or thousands per year |
| Design service analysis | Included with service-specific dashboard pages | Requires a comparable workbook setup | May require custom reports |
| Project ID lookup | Included in the Search Sheet tab | Possible with formulas | Usually available through records or search |
Who Should Use This Template
Graphic Design Studio Dashboard in Google Sheets
- Graphic design studios that want one view of revenue, hours, revisions, and client value.
- Creative agencies that manage multiple designers, service types, and client portfolios.
- Freelance designers who need better visibility into project income, time spent, and delivery quality.
- Marketing teams that run design work internally and want a Google Sheets reporting format.
- Studio managers who need simple performance reporting without adopting a full SaaS platform.
This is not the best fit if you need automated invoicing, native integrations with every design tool, time tracking timers, or a full project management system with task dependencies.
Real-World Use Cases
Studio Owner Reviewing Monthly Profitability
A studio owner can use the Overview Page and Client Portfolio tab to compare revenue, cost, profit, and margin. This makes it easier to decide which clients deserve retention focus and which services need pricing changes.
Creative Director Balancing Team Workload
A creative director can use the Creative Team tab to compare projects, hours, revenue, and revisions by designer. That helps assign new work based on capacity and delivery patterns.
Operations Lead Reducing Revision Rounds
An operations lead can use the Delivery Desk and Service Studio tabs to find services with high revision counts. The team can then improve briefs, review checkpoints, or approval rules for those service types.
Advantages of Graphic Design Studio Dashboard in Google Sheets
Graphic Design Studio Dashboard in Google Sheets
- Fast to adopt: The workbook is ready to copy and update with your own project data.
- Easy to share: Google Sheets makes collaboration simple for distributed design teams.
- Focused on studio metrics: The pages are shaped around revenue, projects, hours, designers, clients, services, ratings, and revisions.
- Editable formulas and layout: You can adjust labels, add services, and tailor the sheet to your workflow.
- Better review rhythm: The dashboard supports weekly operations reviews, monthly client portfolio reviews, and service pricing checks.
Opportunities for Improvement
The template is intentionally spreadsheet-based, so it does not automatically connect to every design, accounting, or project management tool. Teams that need live integrations may want to pair this dashboard with exports from their existing systems.
It also depends on consistent data entry. If project IDs, service names, statuses, or designer names are entered inconsistently, charts can split similar items into separate categories. A short data-entry standard will make the dashboard more useful over time.
Best Practices
- Keep naming consistent: Use the same service, designer, client, status, and delivery quality labels every time.
- Update data weekly: A weekly update cycle keeps revenue, cost, hours, and delivery status close to reality.
- Review high-revision work: Use revision charts to identify services or clients that need clearer briefs.
- Use slicers for focused reviews: Google Sheets slicers can help filter dashboard views quickly. Google explains slicers in its official Google Docs Editors Help article.
- Protect formula areas: Keep formulas and chart ranges protected when sharing the workbook with a team.
Explore Relevant Templates
- Graphic Design Studio Dashboard in Google Sheets
- Architecture and Design Dashboard in Google Sheets
- Advertising Dashboard in Google Sheets
- Photography Dashboard in Google Sheets
Frequently Asked Questions
Graphic Design Studio Dashboard in Google Sheets
What is the Graphic Design Studio Dashboard in Google Sheets?
It is an editable Google Sheets dashboard template for tracking design studio revenue, projects, hours, designers, clients, services, ratings, revisions, and delivery quality.
Which pages are included?
The workbook includes Overview, Service Studio, Creative Team, Client Portfolio, Delivery Desk, Search Sheet, and Data Sheet tabs.
What project fields can I search by Project ID?
The Search Sheet can show matching project details such as date, client, service type, designer, status, priority, hours spent, revenue, cost, client rating, and revisions.
Can I use it with my team?
Yes. Because it is built in Google Sheets, you can share the copied workbook with teammates through Google Drive permissions.
Does it connect automatically to design tools or accounting software?
No. This is a spreadsheet dashboard. You can paste or import exported data, but it does not include native integrations with design tools, invoicing systems, or accounting platforms.
Can I customize the dashboard?
Yes. You can edit sheet labels, formulas, chart ranges, service names, and the data structure to match your studio workflow.
Is it a full project management platform?
No. It is designed for dashboard reporting and lookup. Teams that need task dependencies, automated reminders, and built-in approvals may still need a dedicated project management tool.
About the Author
Built by PK – Microsoft Certified Professional with 15+ years of Excel, Google Sheets, and Power BI experience. Founder of NextGenTemplates, reaching 300K+ subscribers across YouTube channels. Every template is hand-built and tested before release.
Conclusion
The Graphic Design Studio Dashboard in Google Sheets is a practical reporting workbook for studios that need clearer visibility into revenue, service performance, designer workload, client profitability, ratings, and revisions. It gives design teams a repeatable way to review the business side of creative delivery without rebuilding the dashboard from scratch.
For more spreadsheet dashboard tutorials and workflow ideas, visit NeoTechNavigators on YouTube.