Music and Performing Arts Dashboard in Google Sheets is built for music venues, performing arts centers, concerts, festivals, theatres, cultural nonprofits, and event teams that need one practical place to review revenue, expenses, tickets, attendance, surplus, budgets, artists, genres, venues, ratings, and event status. According to the U.S. Bureau of Economic Analysis, arts and cultural economic activity represented 4.2 percent of U.S. GDP, or $1.17 trillion, in 2023. When teams manage that activity in scattered files, reporting becomes slow and difficult to trust.
This dashboard gives teams a ready-to-use Google Sheets structure with multiple pages, cards, charts, slicers, a Search sheet, and a Data Sheet tab. You can replace the sample event records, filter the dashboard quickly, and use the visuals for weekly reviews, post-event analysis, budget conversations, and leadership updates.
Get the Music and Performing Arts Dashboard in Google Sheets
Key Features of Music and Performing Arts Dashboard in Google Sheets
- 4 high-level KPI cards: Revenue, Expenses, Tickets, and Surplus appear at the top of the Overview Page.
- Multiple dashboard pages: Overview, Events and Performances, Ticket Sales, Artists Genres and Ratings, Budget Expenses and Profitability, Search, and Data Sheet tabs are included.
- 30 chart views: The dashboard covers event type, venue, city, month, artist, genre, ratings, ticket revenue, budget, expenses, capacity, and surplus analysis.
- Interactive slicers: Apply quick filters in Google Sheets so each page can be reviewed by the dimensions that matter most.
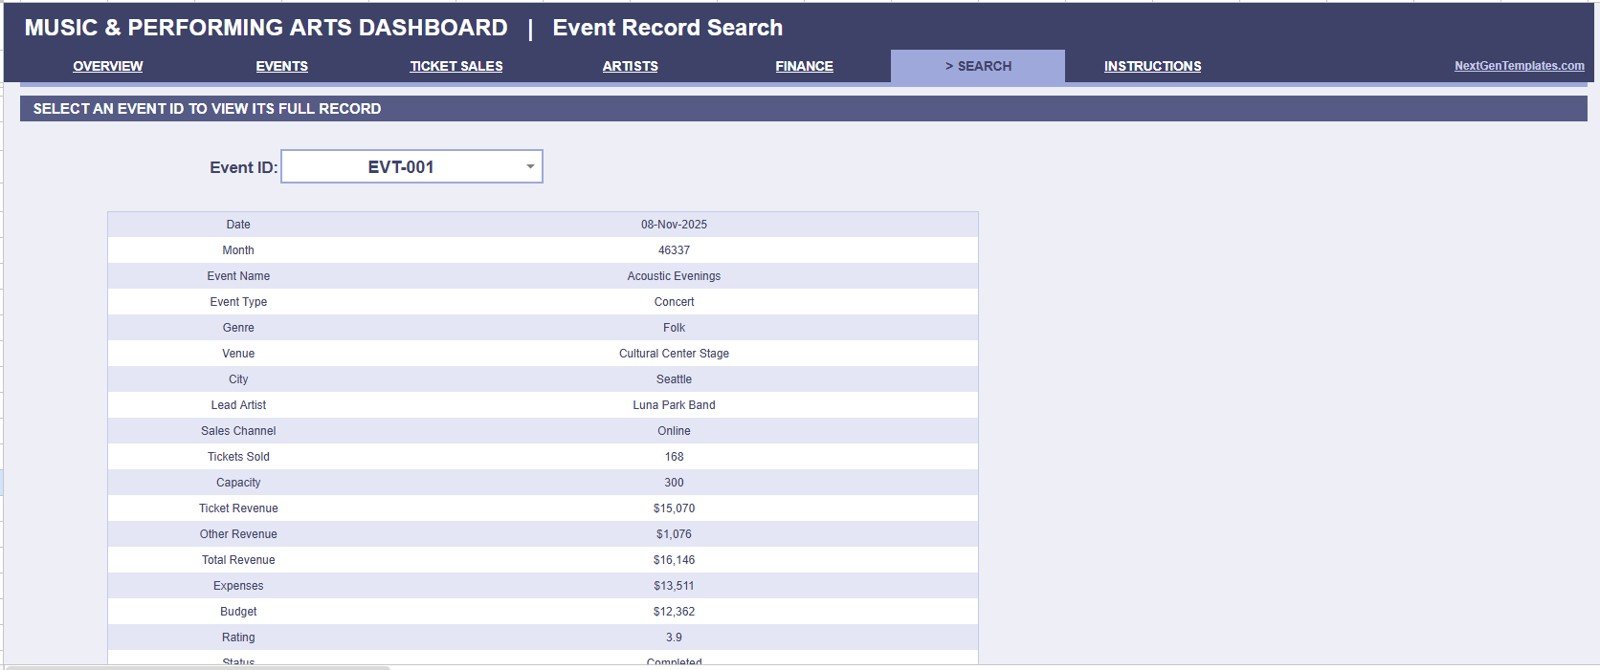
- Event record search: Select an Event ID and instantly view the full row details without scrolling the Data Sheet.
- Editable data structure: Add records in the same column format and keep the workbook usable for recurring reporting.
- Shareable Google Sheets workflow: Use Google Drive permissions for team access, review-only links, or collaborative updates.
Dashboard Pages Explanation
1. Overview Page
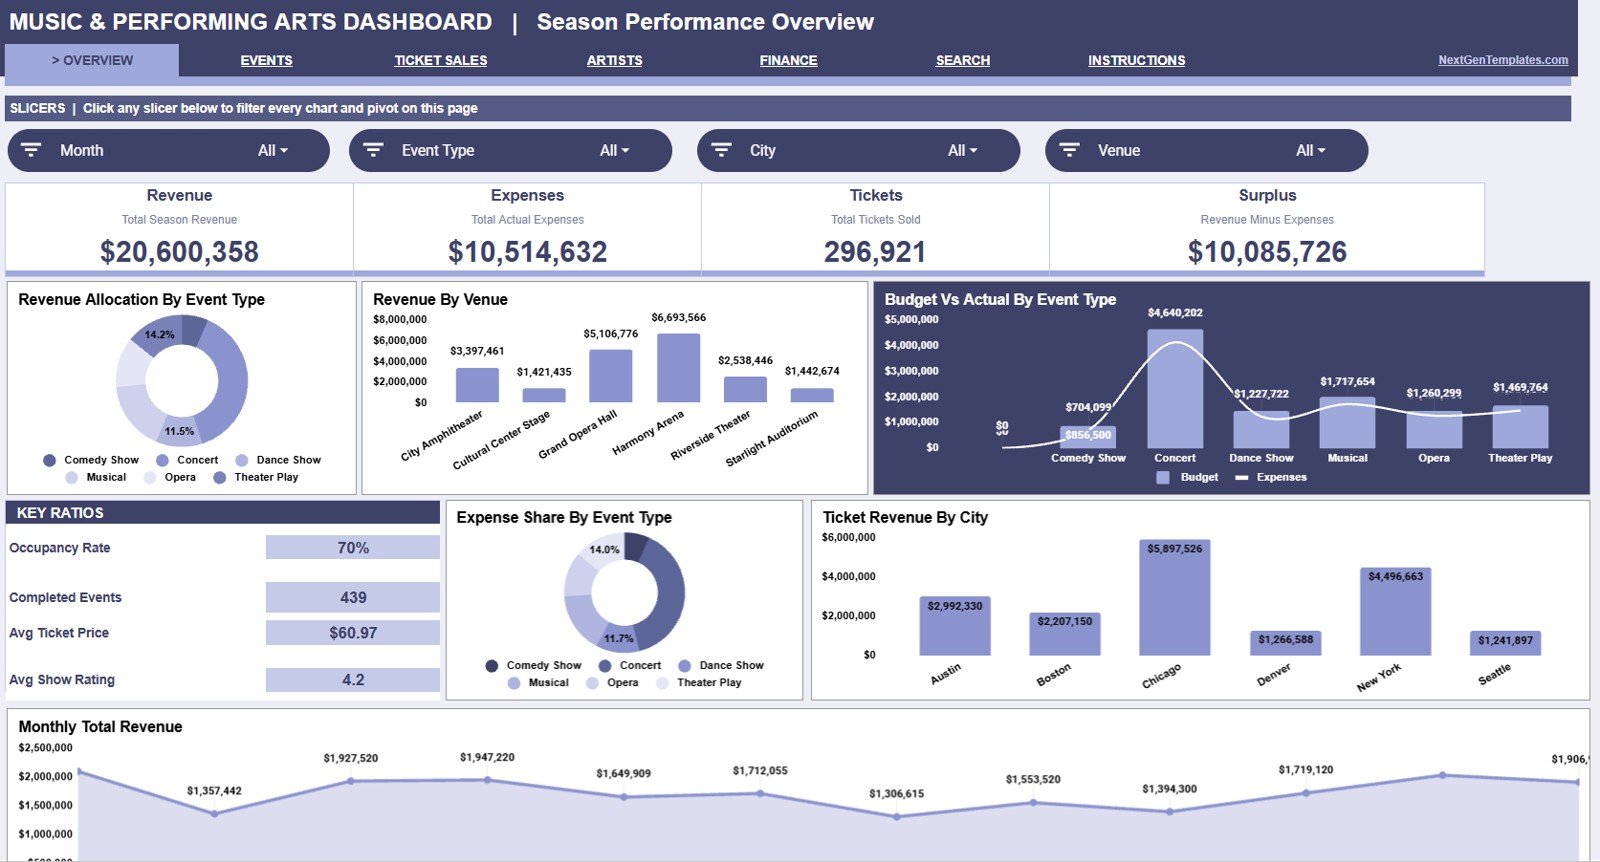
The Overview Page is the executive summary for the dashboard. It starts with cards for Revenue, Expenses, Tickets, and Surplus so users can understand the overall financial and audience picture before reviewing details.
Revenue Allocation by Event Type: This chart shows how total revenue is distributed across event types. Use it to understand whether concerts, theatre, dance, festivals, workshops, or other event categories drive the strongest income.
Revenue by Venue: This chart compares revenue across venues. It helps managers identify high-performing locations and spot venues that may need pricing, marketing, or scheduling changes.
Budget Vs Actual by Event Type: This chart compares planned budget with actual results by event type. It helps teams see which categories are staying on plan and which ones require closer budget control.
Expense Share by Event Type: This chart shows how expenses are distributed across event categories. It is useful when managers need to understand where production, staffing, venue, or marketing costs are concentrated.
Ticket Revenue by City: This chart compares ticket revenue by city. It helps touring teams, festival organizers, and venue managers understand which markets are producing stronger ticket income.
Monthly Total Revenue by Month: This chart shows revenue movement across months. It helps users review seasonality, event timing, campaign impact, and month-over-month performance.
2. Events and Performances Analysis
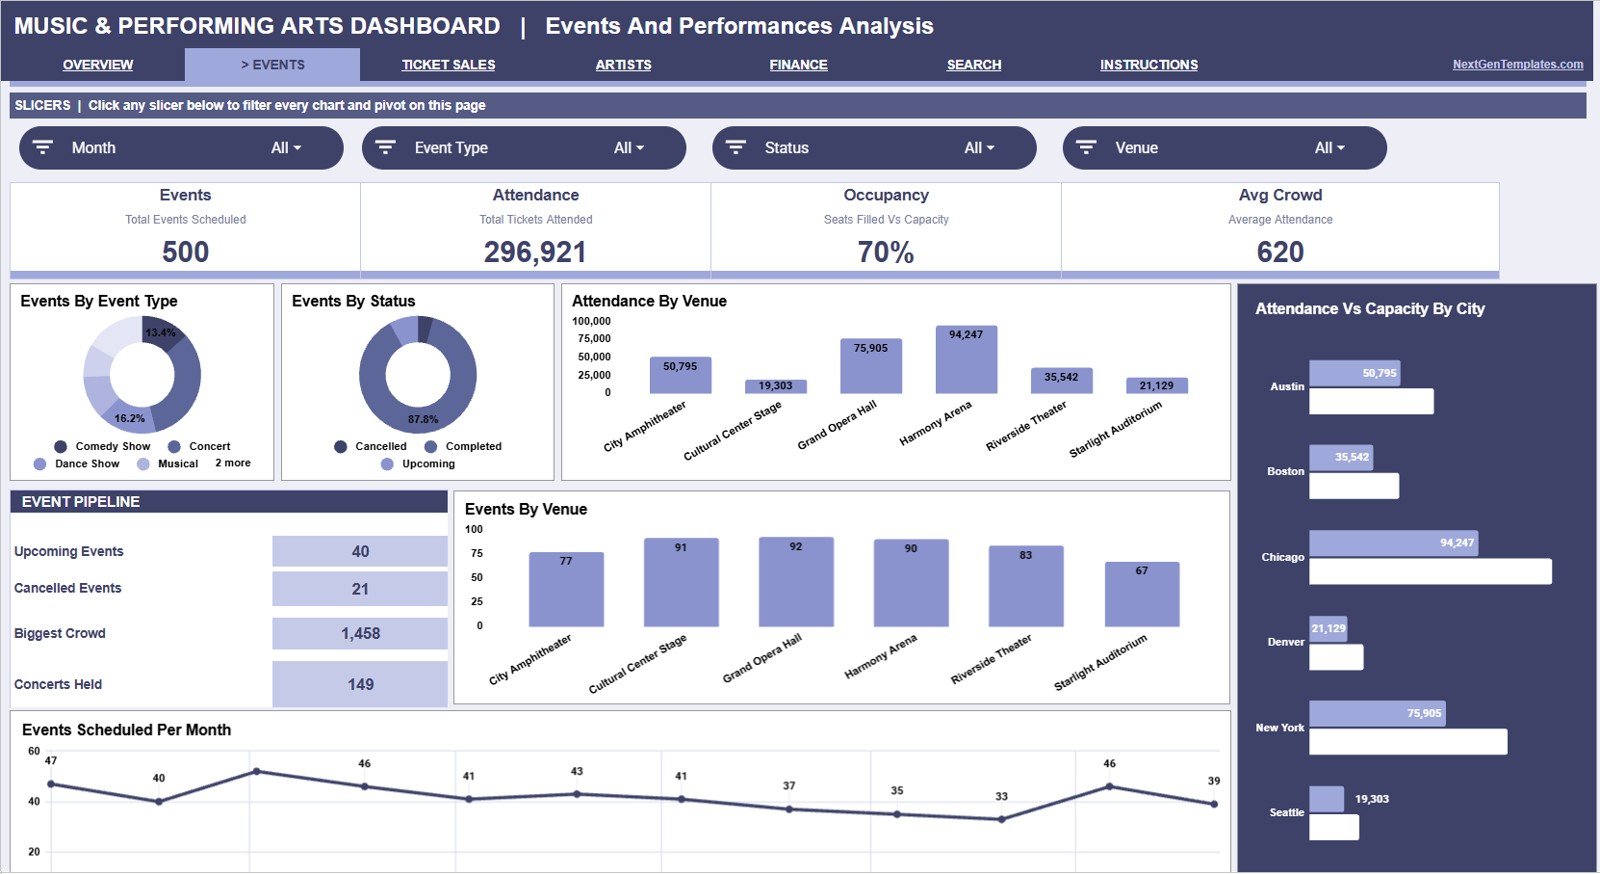
This sheet tab focuses on the event calendar, status, attendance, capacity, and venue activity. It helps programming, operations, and leadership teams understand how many performances are happening and how audiences are responding.
Events by Event Type: This chart shows the count of events across event categories. Use it to see whether the season is balanced across concerts, plays, recitals, festivals, workshops, and other formats.
Events by Status: This chart groups events by status, such as scheduled, completed, cancelled, or pending. It helps teams spot planning delays and quickly understand how much of the event calendar is still active.
Attendance by Venue: This chart compares total attendance across venues. It helps users identify spaces that attract the highest audience volume and those that may need better programming or promotion.
Attendance Vs Capacity by City: This chart compares attendance against capacity by city. It helps teams see where demand is close to the limit and where there is room to improve seat utilization.
Events by Venue: This chart shows event counts by venue. It is useful for managing venue workload, avoiding overuse, and planning a more balanced calendar.
Events Scheduled by Month: This chart shows how events are distributed across months. Use it to identify busy periods, quiet months, and scheduling gaps before the season is finalized.
3. Ticket Sales and Audience Analysis
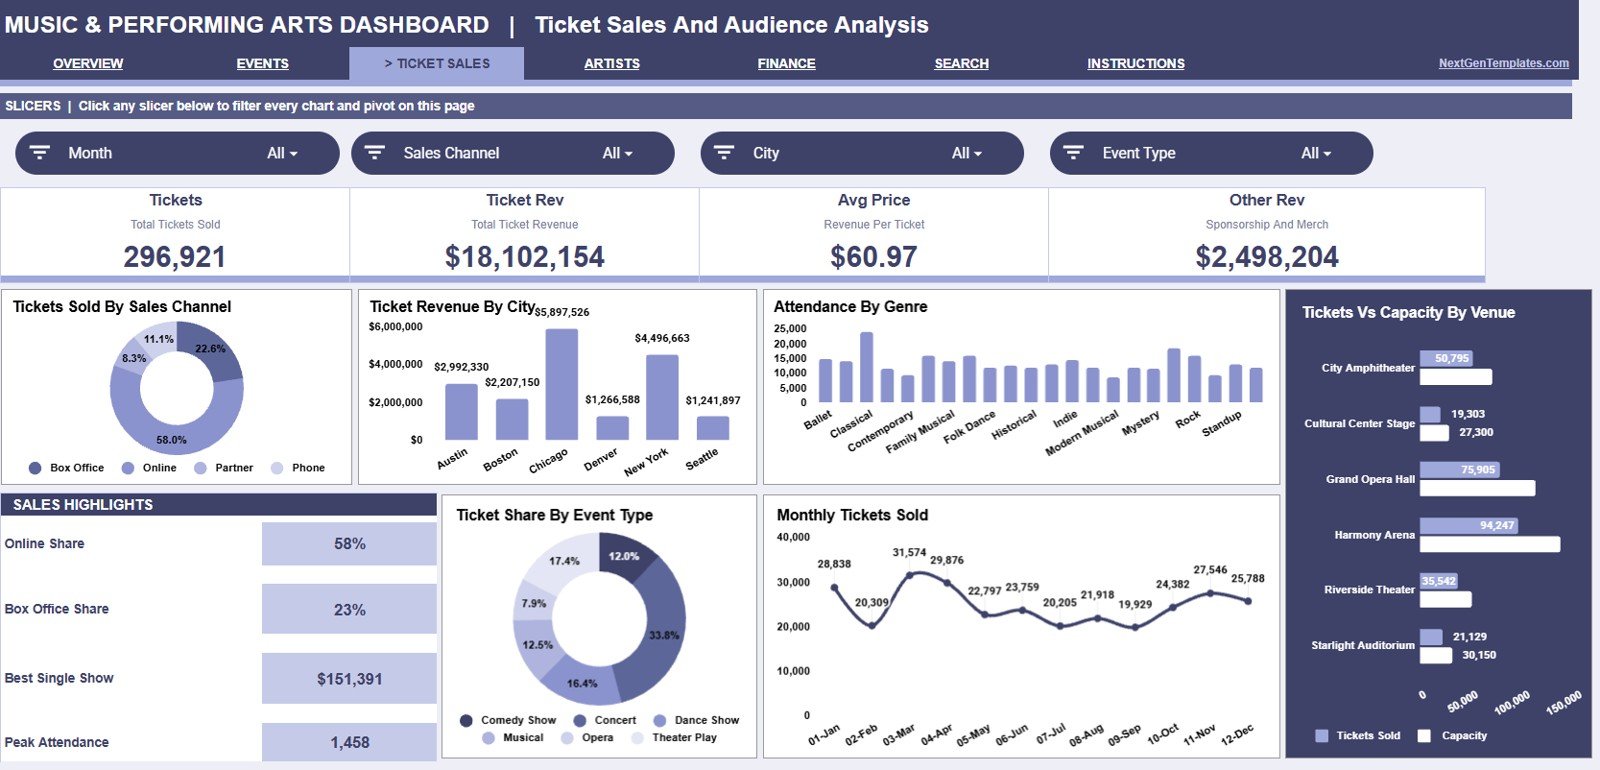
The Ticket Sales and Audience Analysis tab is designed for box office, marketing, venue, and audience development teams. It brings together ticket sales channels, city revenue, genre attendance, venue capacity, event share, and monthly ticket movement.
Tickets Sold by Sales Channel: This chart shows how many tickets are sold through each channel. It helps teams compare direct sales, online platforms, partners, box office sales, and other channels.
Ticket Revenue by City: This chart compares ticket income by city. It helps managers understand which markets deserve more promotion, repeat events, or pricing attention.
Attendance by Genre: This chart shows attendance by genre. It helps programming teams understand which music and performing arts categories attract the strongest audiences.
Tickets Vs Capacity by Venue: This chart compares sold tickets with venue capacity. It is useful for identifying underfilled spaces, near-sellout venues, and opportunities to move shows into better rooms.
Ticket Share by Event Type: This chart shows the share of tickets sold by event type. It helps users see which formats contribute most to audience volume.
Monthly Tickets Sold by Month: This chart tracks ticket sales over time. It helps teams see seasonal peaks, campaign effects, and periods that may need additional promotion.
Get the Music and Performing Arts Dashboard in Google Sheets
4. Artists Genres and Ratings Analysis
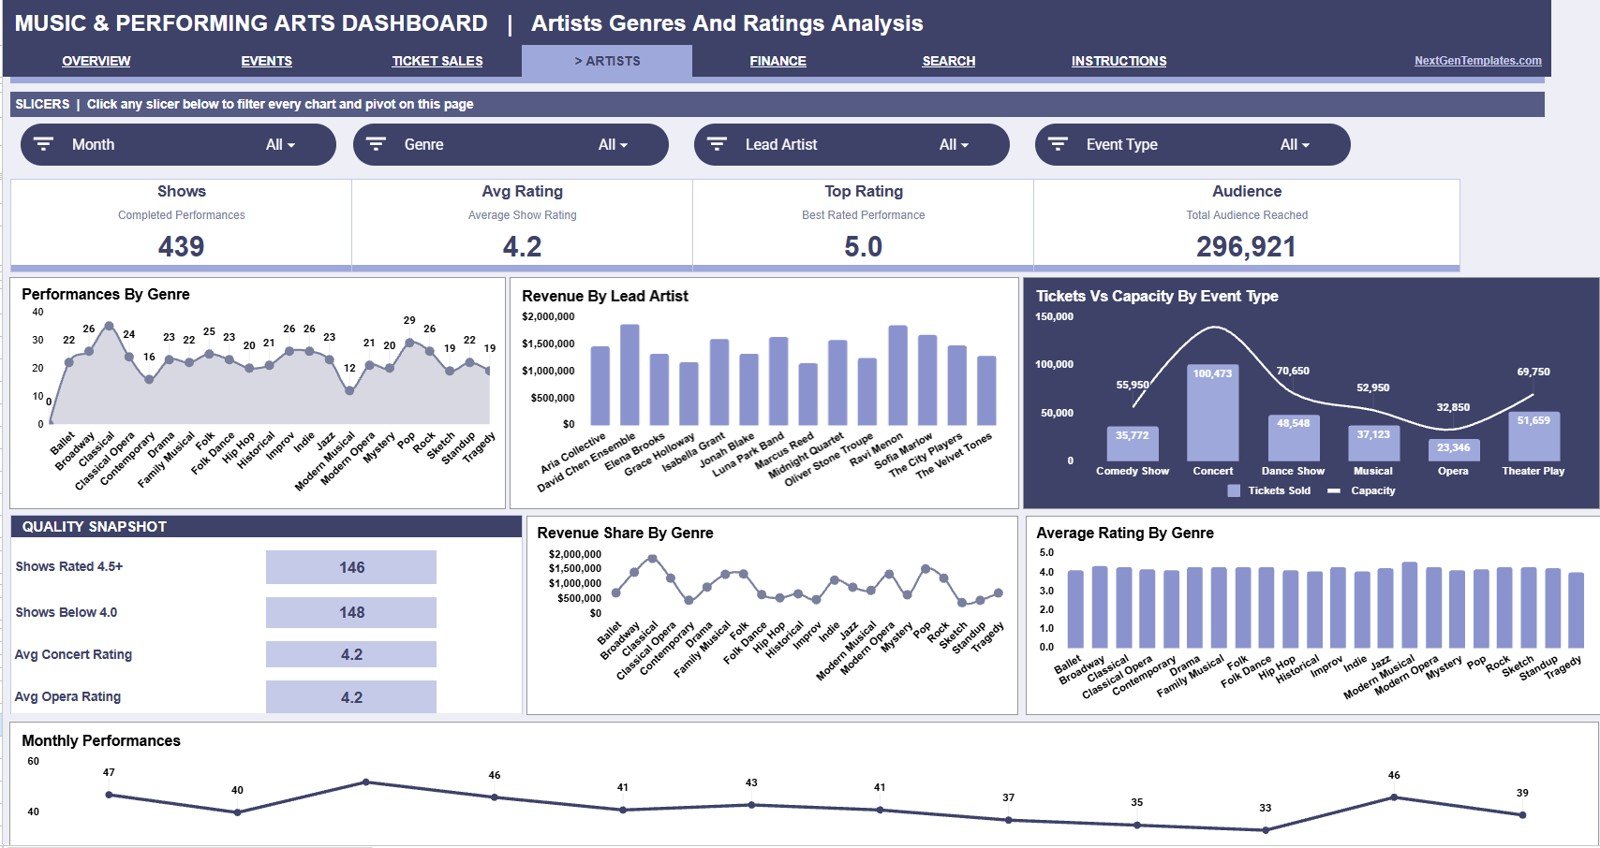
The Artists Genres and Ratings Analysis tab links artistic programming to ticket capacity, revenue, genre mix, and audience rating. It is helpful for booking reviews, artistic planning, marketing summaries, and post-event evaluation.
Performances by Genre: This chart counts performances by genre. It helps users see whether the program mix is broad, concentrated, or missing important categories.
Revenue by Lead Artist: This chart compares revenue generated by lead artist. It supports artist booking discussions and helps teams review which artists are driving stronger commercial results.
Tickets Vs Capacity by Event Type: This chart compares ticket volume with capacity by event type. It helps managers see which types of performances are filling available seats more effectively.
Revenue Share by Genre: This chart shows each genre’s contribution to total revenue. It helps teams compare artistic variety with financial contribution.
Average Rating by Genre: This chart compares average ratings across genres. It helps programming and audience development teams understand where audience satisfaction is strongest.
Monthly Performances by Month: This chart shows the number of performances by month. It helps teams review season pacing and match programming volume with audience demand.
Get the Music and Performing Arts Dashboard in Google Sheets
5. Budget Expenses and Profitability
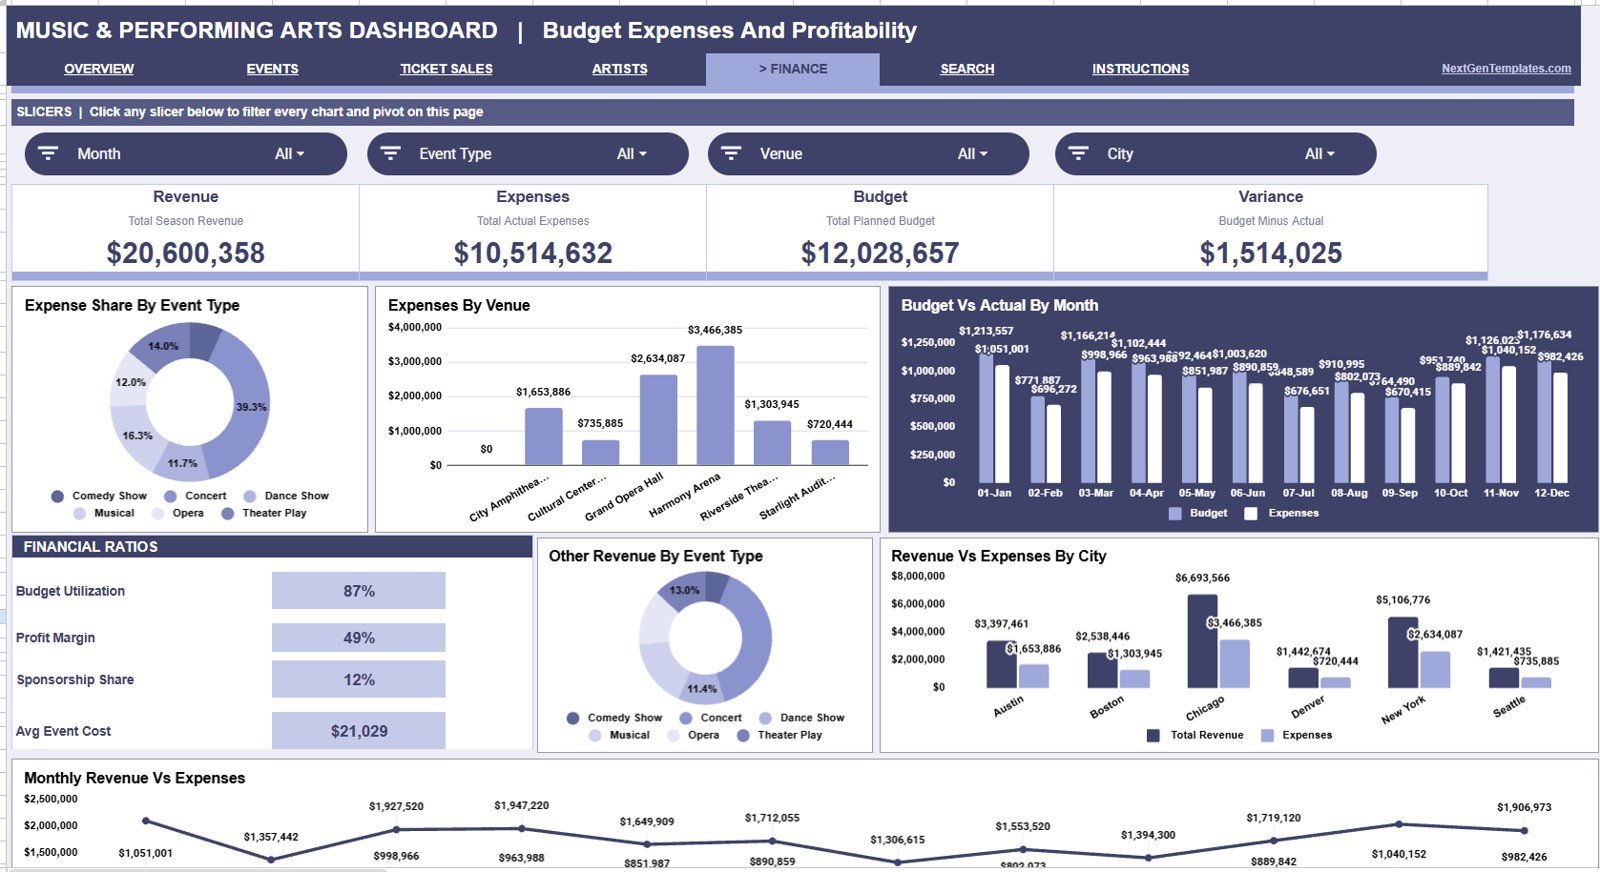
The Budget Expenses and Profitability tab gives finance, production, and event leaders a clean place to compare costs, budgets, revenue, and surplus. It is useful before budget meetings, grant reporting, sponsor reviews, and post-event debriefs.
Expense Share by Event Type: This chart shows how much of total expense belongs to each event type. It helps users understand which programming areas are more cost-intensive.
Expenses by Venue: This chart compares expenses across venues. It helps teams review whether certain spaces consistently require more production, staffing, rental, or operational spending.
Budget Vs Actual by Month: This chart compares budgeted and actual amounts over time. It helps finance teams spot months where spending is above or below plan.
Other Revenue by Event Type: This chart shows non-ticket revenue by event type. It can include sponsorship, merchandise, concessions, donations, or other income streams depending on how the data is prepared.
Revenue Vs Expenses by City: This chart compares financial performance across cities. It helps teams understand whether strong revenue markets are also producing healthy surplus after expenses.
Monthly Revenue Vs Expenses by Month: This chart compares revenue and expenses month by month. It helps leadership see whether financial performance is improving, narrowing, or becoming less predictable.
6. Search Page
The Search sheet includes an Event Record Search feature. Select an Event ID from the dropdown and the sheet instantly displays Date, Month, Event Name, Event Type, Genre, Venue, City, Lead Artist, Sales Channel, Tickets Sold, Capacity, Ticket Revenue, Other Revenue, Total Revenue, Expenses, Budget, Rating, and Status.
This view is useful when someone asks about one specific performance or event. Instead of filtering the raw data manually, the user can open the Search sheet and review the complete event record in a clean lookup format.
Get the Music and Performing Arts Dashboard in Google Sheets
7. Data Sheet Tab
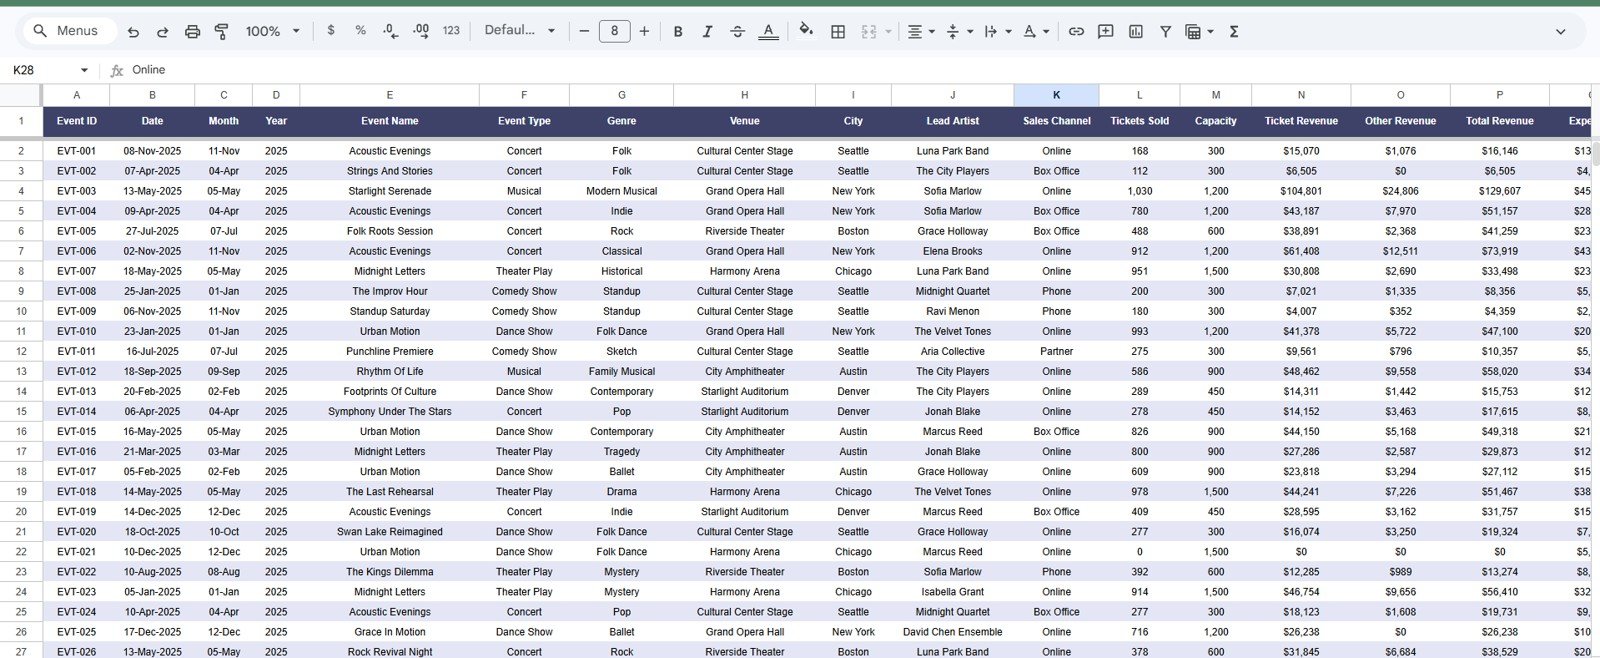
The Data Sheet tab is where you add your music and performing arts records in the same format as the sample data. Keep the column structure consistent so the dashboard pages, charts, slicers, and Search sheet can continue reading the data correctly.
Typical fields include Event ID, Date, Month, Event Name, Event Type, Genre, Venue, City, Lead Artist, Sales Channel, Tickets Sold, Capacity, Ticket Revenue, Other Revenue, Total Revenue, Expenses, Budget, Rating, and Status.
Get the Music and Performing Arts Dashboard in Google Sheets
Music and Performing Arts Dashboard in Google Sheets vs. Microsoft Excel Dashboard vs. Paid CRM/SaaS – Feature Comparison
| Feature | Music and Performing Arts Dashboard in Google Sheets | Microsoft Excel dashboard | Paid event SaaS or CRM |
|---|---|---|---|
| Cost | $9.99 one-time | Template cost plus Excel license | Monthly or annual subscription |
| Platform | Browser-based Google Sheets | Desktop Excel or Microsoft 365 | Vendor cloud app |
| Setup time | Copy workbook, replace data, review dashboards | Open workbook, update data, refresh pivots | Configuration and onboarding usually required |
| Real-time team collaboration | Built into Google Sheets sharing | Possible with OneDrive or SharePoint | Usually available by plan or seat |
| Mobile access | Google Sheets app and browser | Excel mobile app with limits | Usually available |
| Customizable fields | Editable data, formulas, charts, and slicers | Editable workbook | Often limited by vendor settings |
| Share with link | Yes, through Google Drive permissions | Possible through cloud storage | Often login-based |
| Year-1 cost at 5 users | $9.99 total | Template plus license costs | Can reach hundreds or thousands |
| Event record lookup | Included Search sheet | Requires setup unless included | Usually included |
| Ticketing automation | Manual or export-based data entry | Manual or export-based data entry | Often included at higher cost |
Who Should Use This Template
- Performing arts centers that need a simple way to review events, tickets, revenue, expenses, budgets, and surplus.
- Concert organizers and music venues that track attendance, capacity, venue performance, and artist revenue.
- Theatre, dance, festival, and cultural teams preparing monthly reporting for leadership, funders, or sponsors.
- Arts finance teams that need budget vs actual and revenue vs expenses without building a reporting file from scratch.
- Consultants who prepare Google Sheets dashboards for entertainment, culture, venue, or live event clients.
Real-World Use Cases
Maya, performing arts venue manager: Maya opens the Overview Page before each weekly operations meeting to review revenue, expenses, tickets, and surplus. She then checks Tickets Vs Capacity by Venue to decide which events need more promotion.
David, festival finance lead: David uses Budget Vs Actual by Month and Monthly Revenue Vs Expenses by Month to prepare end-of-month reporting. The charts make it easier to explain cost pressure and surplus movement to leadership.
Priya, music program coordinator: Priya reviews Revenue by Lead Artist and Average Rating by Genre before planning the next season. She uses the Search sheet during calls when someone asks for one specific Event ID.
Advantages of Music and Performing Arts Dashboard in Google Sheets
- Clearer reporting cadence: The dashboard helps teams move from scattered event files to a repeatable reporting process.
- Low cost: The template is a one-time purchase, so small teams can avoid monthly dashboard software fees.
- Easy collaboration: Google Sheets makes it simple to share the dashboard with operations, finance, programming, or leadership users.
- Audience and finance in one view: The workbook connects ticket volume, attendance, capacity, revenue, expenses, budgets, artists, genres, venues, and ratings.
- Fast lookup: The Search sheet reduces the time spent scrolling through raw event records.
Opportunities for Improvement
- The dashboard does not include direct ticketing, CRM, or accounting software integrations. Teams with advanced systems can export data and paste it into the Data Sheet.
- Large event datasets may need periodic cleanup so Google Sheets remains responsive and easy to use.
- Automated email alerts, donor workflows, seating maps, barcode scanning, and payment processing are outside the scope of this spreadsheet template.
- Teams can add more fields for sponsor revenue, merchandise, donor category, member attendance, or production cost if they need deeper analysis.
Best Practices
Get the Music and Performing Arts Dashboard in Google Sheets
- Keep Event ID values unique so the Search sheet returns the correct record every time.
- Use consistent event type, genre, venue, city, artist, sales channel, and status names so charts group records cleanly.
- Update the Data Sheet on a fixed weekly or monthly schedule before reviewing the dashboard with stakeholders.
- Use view-only sharing for leadership users and edit access only for people responsible for maintaining data.
- Use Google Sheets slicers carefully. Google explains how to filter charts and tables with slicers in the official Google Docs Editors Help documentation.
- Keep a backup copy before making major formula, chart, or layout changes.
Explore Relevant Templates
- Music School Dashboard in Google Sheets – track enrollments, revenue, instructors, branches, and programs.
- Arts and Culture Dashboard in Google Sheets – review exhibitions, cultural events, programs, venues, artists, visitors, and costs.
- Event Success Tracking Dashboard in Google Sheets – analyze event revenue, tickets, capacity, city, venue, and status.
- Music & Performing Arts KPI Dashboard in Excel – Excel-based KPI tracking for arts and music teams.
- Ticketing and Live Events KPI Dashboard in Excel – KPI reporting for ticketing, live events, attendance, and revenue.
- Browse all Google Sheets dashboard templates on NextGenTemplates.
Dashboards like this get easier to build once you know the reporting basics, and the Excel Pivot Tables & Dashboards course on NextGenTemplates Academy covers them step by step with practice files.
Get the Music and Performing Arts Dashboard in Google Sheets
Frequently Asked Questions
Get the Music and Performing Arts Dashboard in Google Sheets
What does the Music and Performing Arts Dashboard in Google Sheets track?
It tracks revenue, expenses, tickets, surplus, event type, genre, venue, city, lead artist, sales channel, tickets sold, capacity, ticket revenue, other revenue, total revenue, budget, rating, and status.
Does the dashboard include an Overview Page?
Yes. The Overview Page includes Revenue, Expenses, Tickets, and Surplus cards plus charts for revenue allocation, venue revenue, budget vs actual, expenses, city ticket revenue, and monthly revenue.
Can I use this dashboard for concerts, theatre, festivals, and dance events?
Yes. The structure is flexible enough for many music and performing arts event types as long as your records follow the same data format.
Does it include a Search sheet?
Yes. The Search sheet lets you choose an Event ID from a dropdown and view the full event record instantly.
Do I need advanced Google Sheets skills?
No. For normal use, you mainly replace sample data, use slicers, and review the dashboard pages. Advanced users can customize formulas, charts, and fields.
Does it connect automatically to ticketing software?
No. This is a spreadsheet dashboard. You can export records from a ticketing system and paste or prepare them in the Data Sheet.
Is this a one-time purchase?
Yes. It is sold as a one-time template purchase on NextGenTemplates, with no monthly subscription for the dashboard itself.
About the Author
Built by PK – Microsoft Certified Professional with 15+ years of Excel, Google Sheets, and Power BI experience. Founder of NextGenTemplates, reaching 300K+ subscribers across YouTube channels. Every template is hand-built and tested before release.
Conclusion
The Music and Performing Arts Dashboard in Google Sheets gives teams a clear way to review performance across revenue, expenses, tickets, surplus, events, attendance, capacity, venues, cities, artists, genres, ratings, budgets, and status. It is a practical fit when you want a shareable spreadsheet dashboard without paying for a full event SaaS platform.
Get the Music and Performing Arts Dashboard in Google Sheets and start organizing your performing arts reporting in one editable workbook.
Last updated: July 28, 2026.