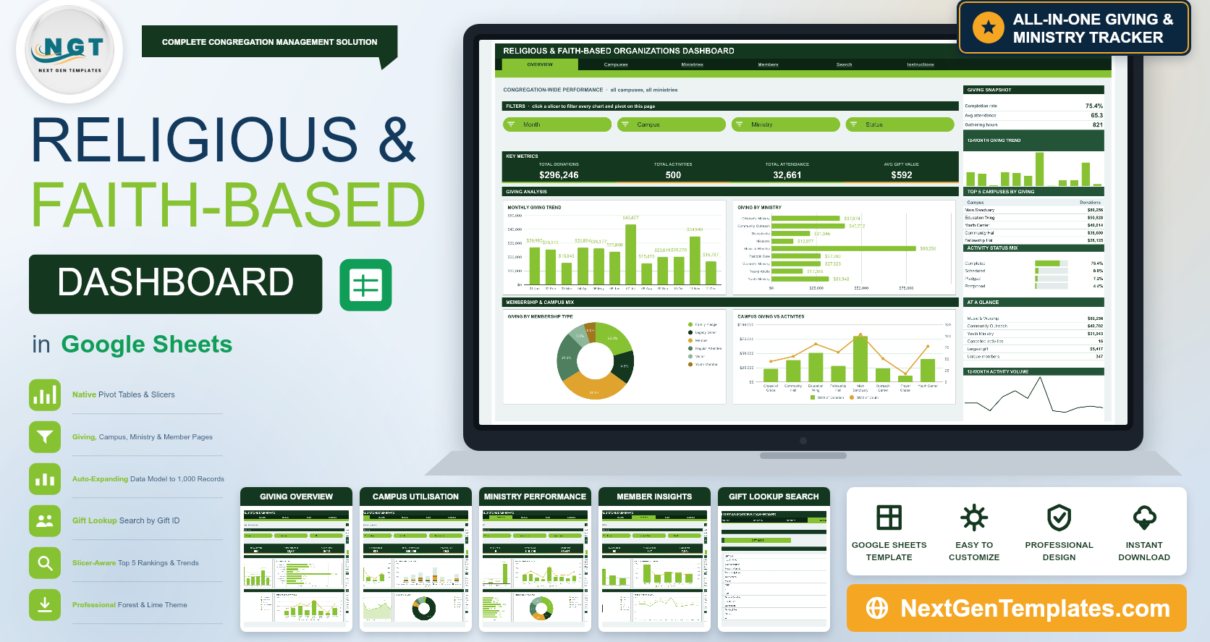
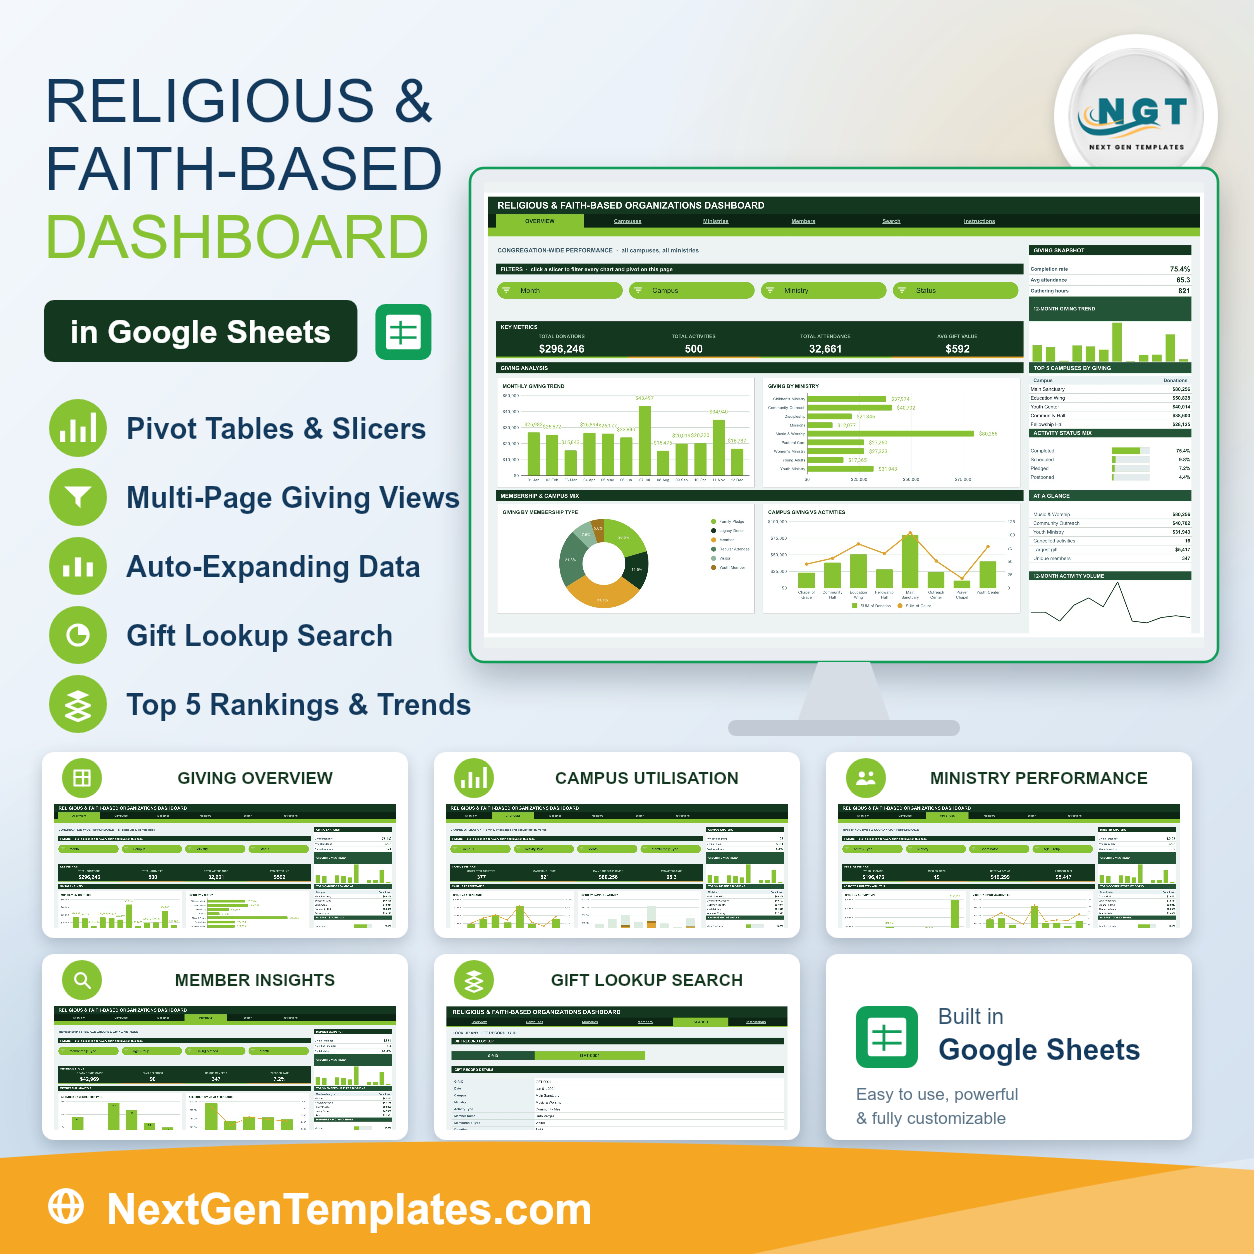
The Religious & Faith-Based Organizations Dashboard in Google Sheets puts giving, attendance and activity reporting for a whole congregation on six linked pages. The sample file carries 500 activity records worth $296,246 in donations and 32,661 attendances, summarised through 16 KPI cards, 16 pivot-driven charts and 16 slicers. Every page holds 1,000 rows of headroom, so you can paste a full year of gift and attendance records without touching a single formula.
Most congregations track this in three places at once: a giving spreadsheet the treasurer owns, an attendance sheet a volunteer keeps, and a ministry calendar living in someone’s inbox. Nobody can answer “which campus gave the most last quarter, and were people actually showing up?” without stitching those three together by hand. This Google Sheets dashboard merges them into one log and reads every question off that single sheet.
Get the Religious & Faith-Based Organizations Dashboard in Google Sheets
Key Features of the Religious & Faith-Based Organizations Dashboard
- Six linked pages – Overview, Campuses, Ministries, Members, Search and Instructions, joined by a navigation strip that sits at the top of every page.
- 16 KPI cards – four per analysis page, covering total donations, total activities, total attendance, average gift value, completed activities, gathering hours, worship giving, mission trips, retreat giving, largest gift, legacy donor giving, family pledges, unique members and pledged rate.
- 16 charts driven by native pivot tables – no SUMPRODUCT chains and no helper columns behind the visuals. Each chart reads a pivot table parked to the right of its page, so the file stays fast as the log grows.
- 16 native slicers – four on each analysis page. Clicking one filters every chart, every pivot and the sidebar Top 5 panel on that page at the same time.
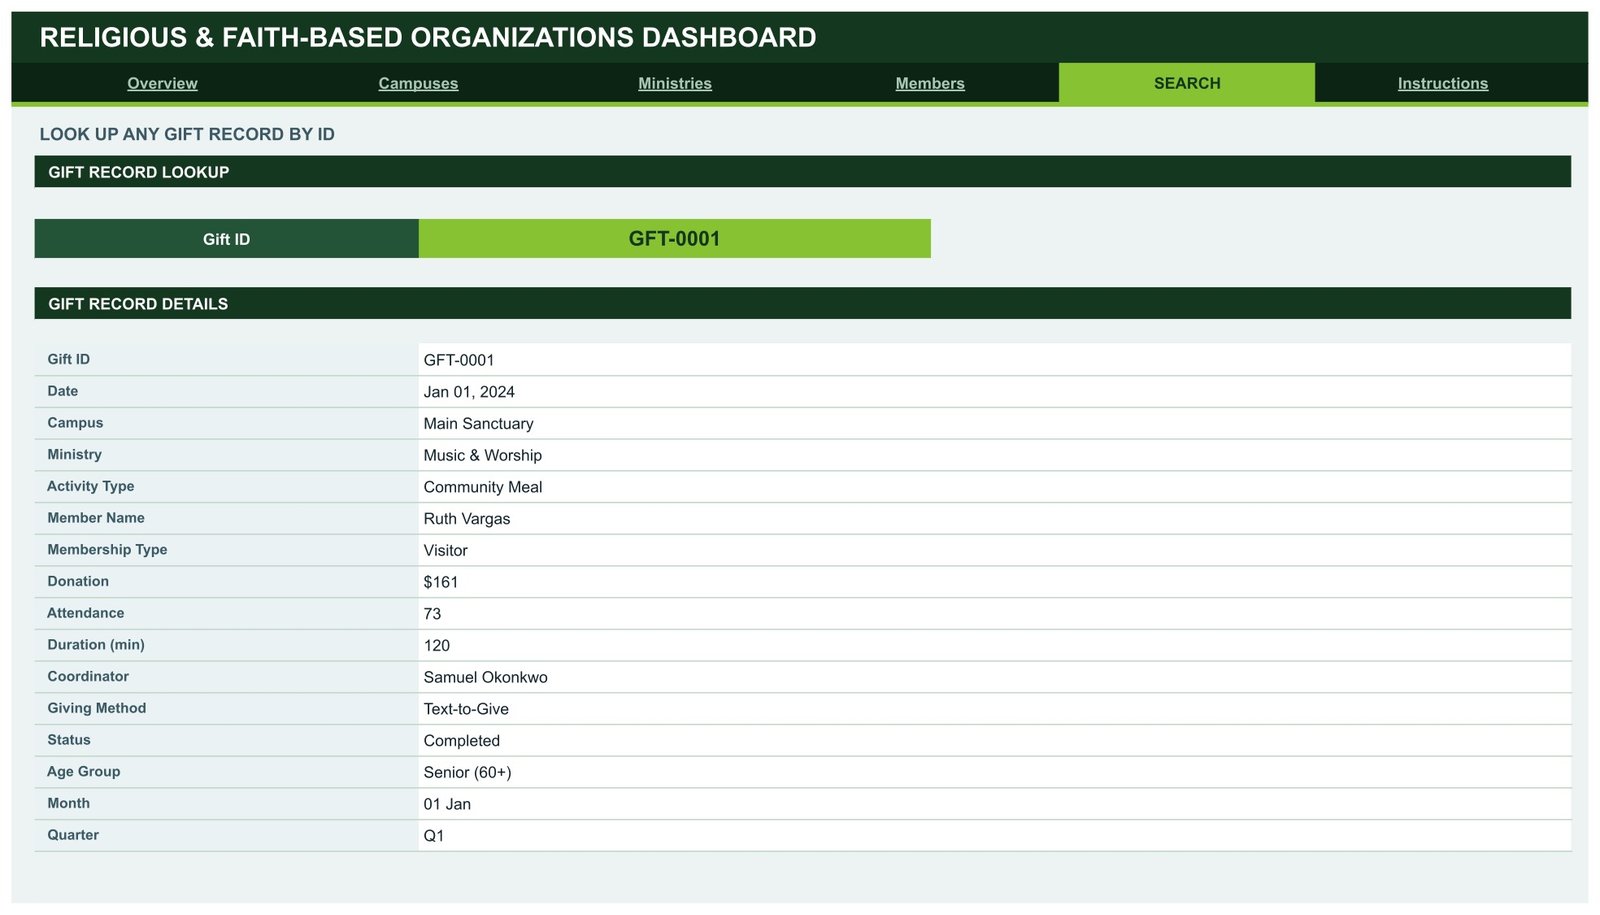
- A Gift ID lookup – type any Gift ID on the Search page and all 16 fields of that record appear, from campus and coordinator to giving method and age group.
- 1,000-row capacity out of the box – pivots, slicers and formulas already cover row 1001. Paste new records anywhere in that range and the dashboard updates itself.
- No add-ons, no macros, no subscription – it is built entirely on features Google Sheets ships with.
Three numbers worth stating plainly: the dashboard tracks 16 distinct KPIs, renders 16 charts, and holds 1,000 gift records before you need to change anything. Raising that ceiling is a one-line edit to the DATA_ROWS value in the bundled Apps Script.
Dashboard Pages Explanation
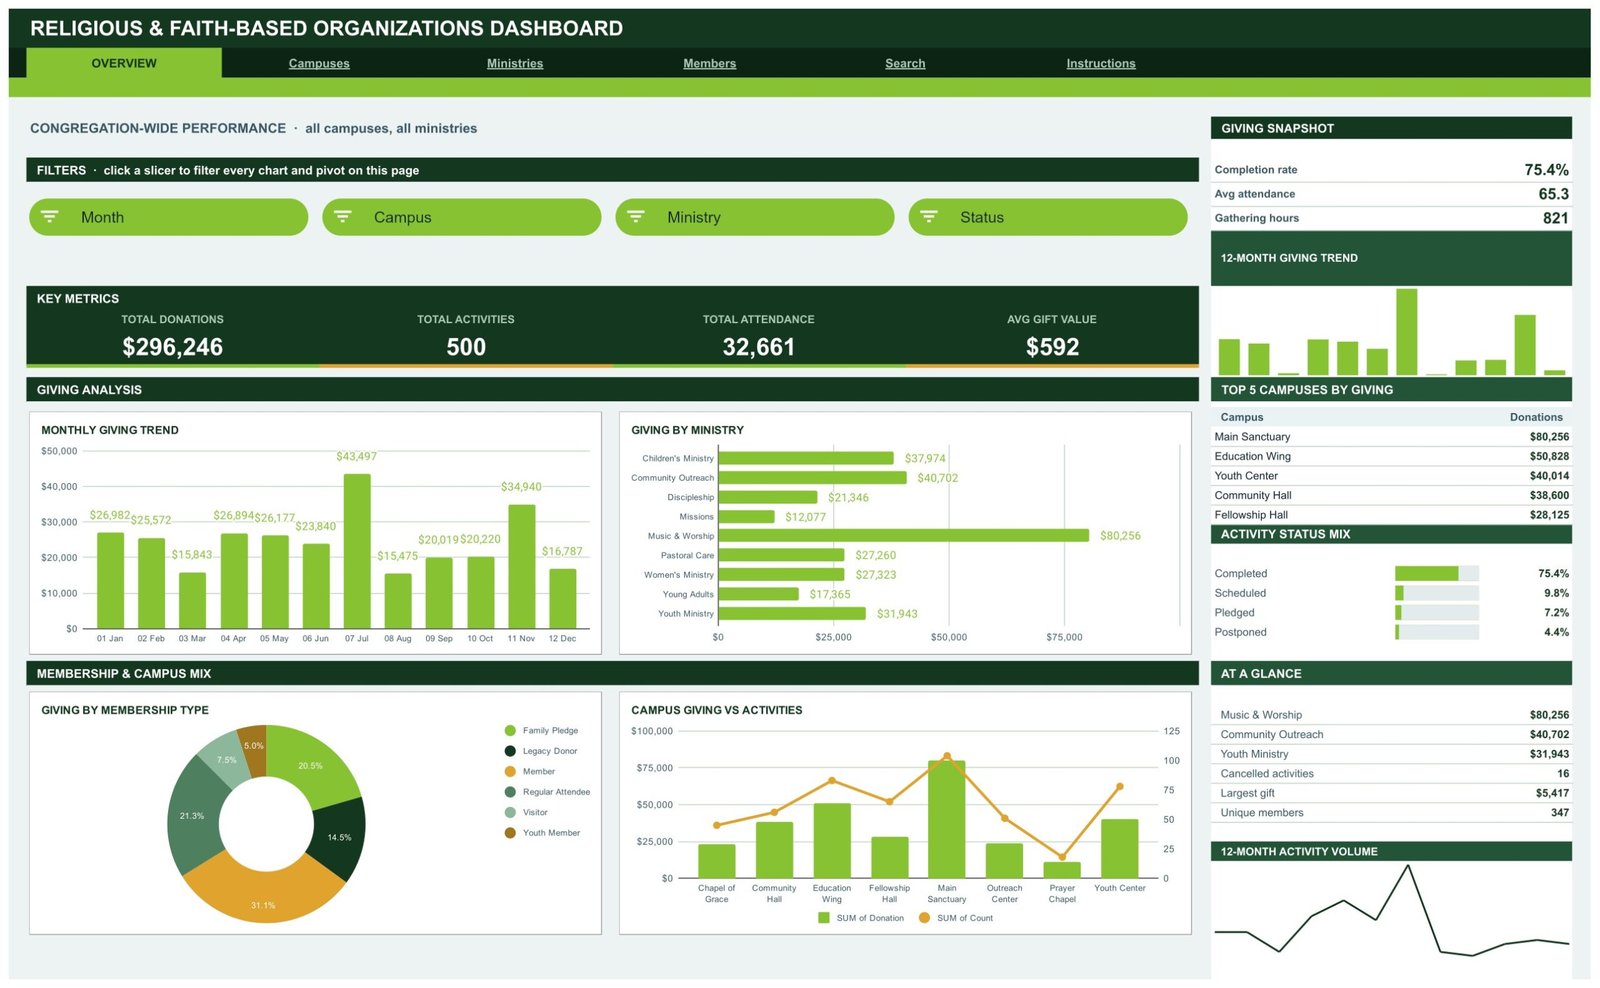
Page 1: Overview – Congregation-Wide Performance
The landing page reports Total Donations, Total Activities, Total Attendance and Average Gift Value, with a sidebar carrying completion rate, average attendance and gathering hours. Charts are Monthly Giving Trend, Giving by Ministry, Giving by Membership Type and Campus Giving vs Activities, plus a Top 5 Campuses by Giving table and an Activity Status Mix panel. Slicers: Month, Campus, Ministry and Status.
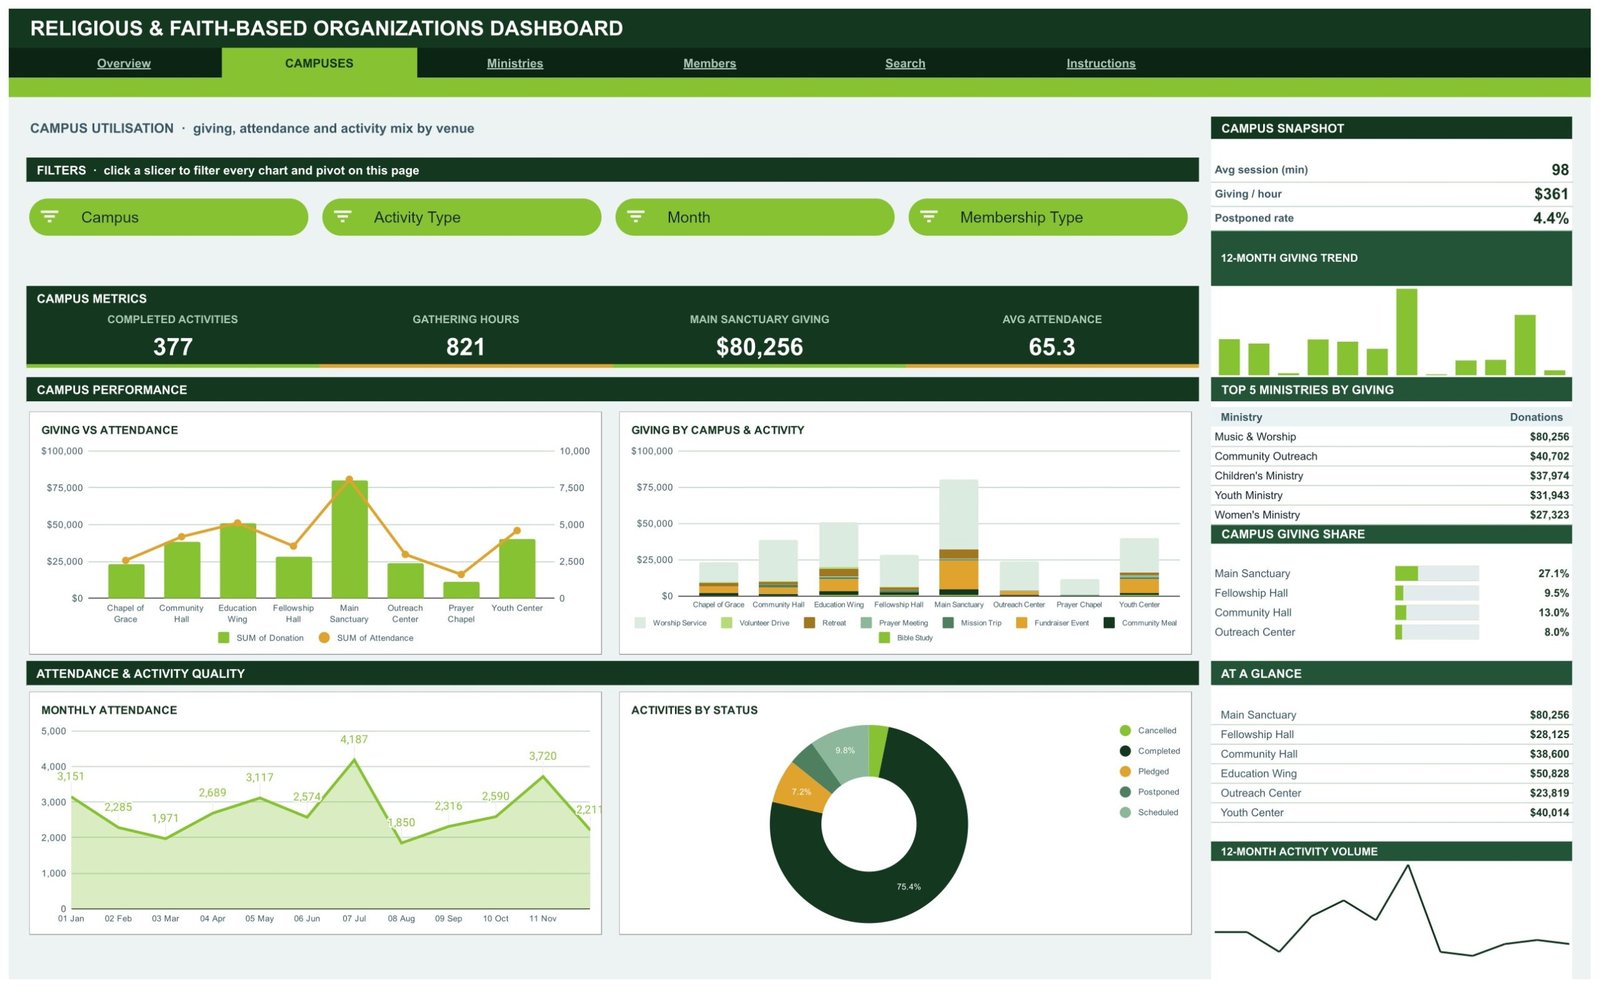
Page 2: Campuses – Venue Utilisation
This page answers whether your buildings are earning their keep. It reports Completed Activities, Gathering Hours, Main Sanctuary Giving and Average Attendance, alongside average session length, giving per hour and postponed rate. Charts are Giving vs Attendance, Giving by Campus and Activity, Monthly Attendance and Activities by Status, with a Campus Giving Share panel. Slicers: Campus, Activity Type, Month and Membership Type.
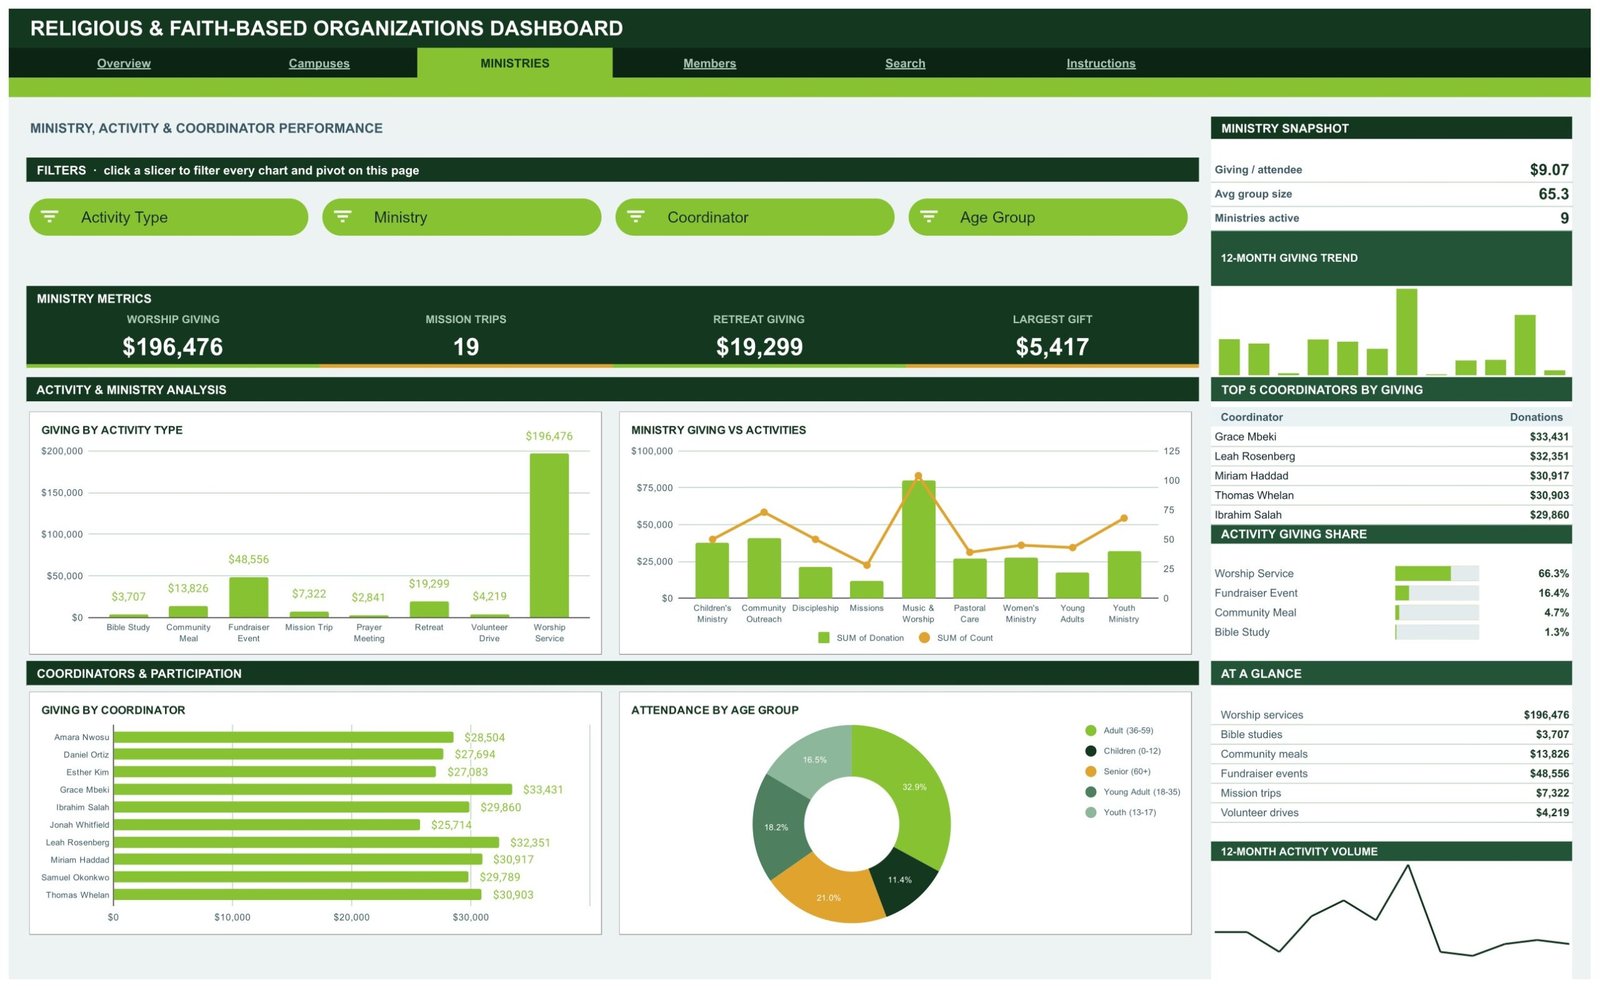
Page 3: Ministries – Ministry, Activity and Coordinator Performance
The ministry view reports Worship Giving, Mission Trips, Retreat Giving and Largest Gift, plus giving per attendee, average group size and the count of active ministries. Charts are Giving by Activity Type, Ministry Giving vs Activities, Giving by Coordinator and Attendance by Age Group, with Top 5 Coordinators by Giving and an Activity Giving Share panel. Slicers: Activity Type, Ministry, Coordinator and Age Group.
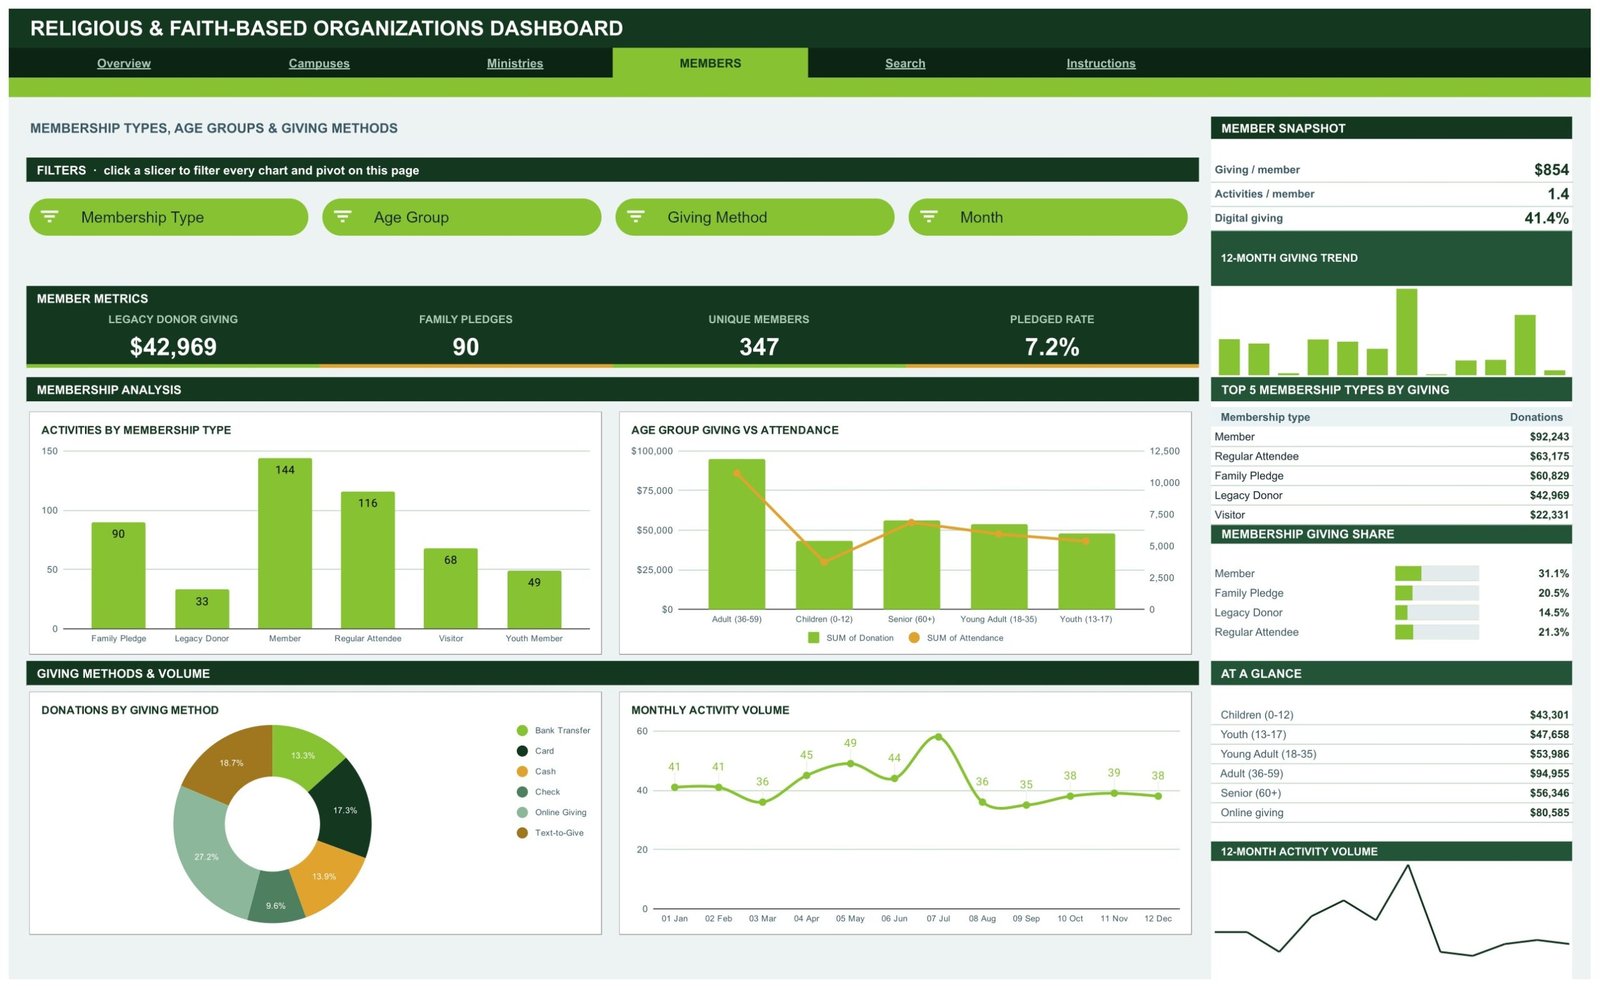
Page 4: Members – Membership Types, Age Groups and Giving Methods
This page profiles who gives and how. It reports Legacy Donor Giving, Family Pledges, Unique Members and Pledged Rate, with giving per member, activities per member and the share of digital giving. Charts are Activities by Membership Type, Age Group Giving vs Attendance, Donations by Giving Method and Monthly Activity Volume, with a Membership Giving Share panel. Slicers: Membership Type, Age Group, Giving Method and Month.
Page 5: Search – Gift Record Lookup
Pick a Gift ID from the dropdown and the page returns the full record: date, campus, ministry, activity type, member name, membership type, donation, attendance, duration, coordinator, giving method, status, age group, month and quarter. This is the page you open when a member asks about a specific gift.
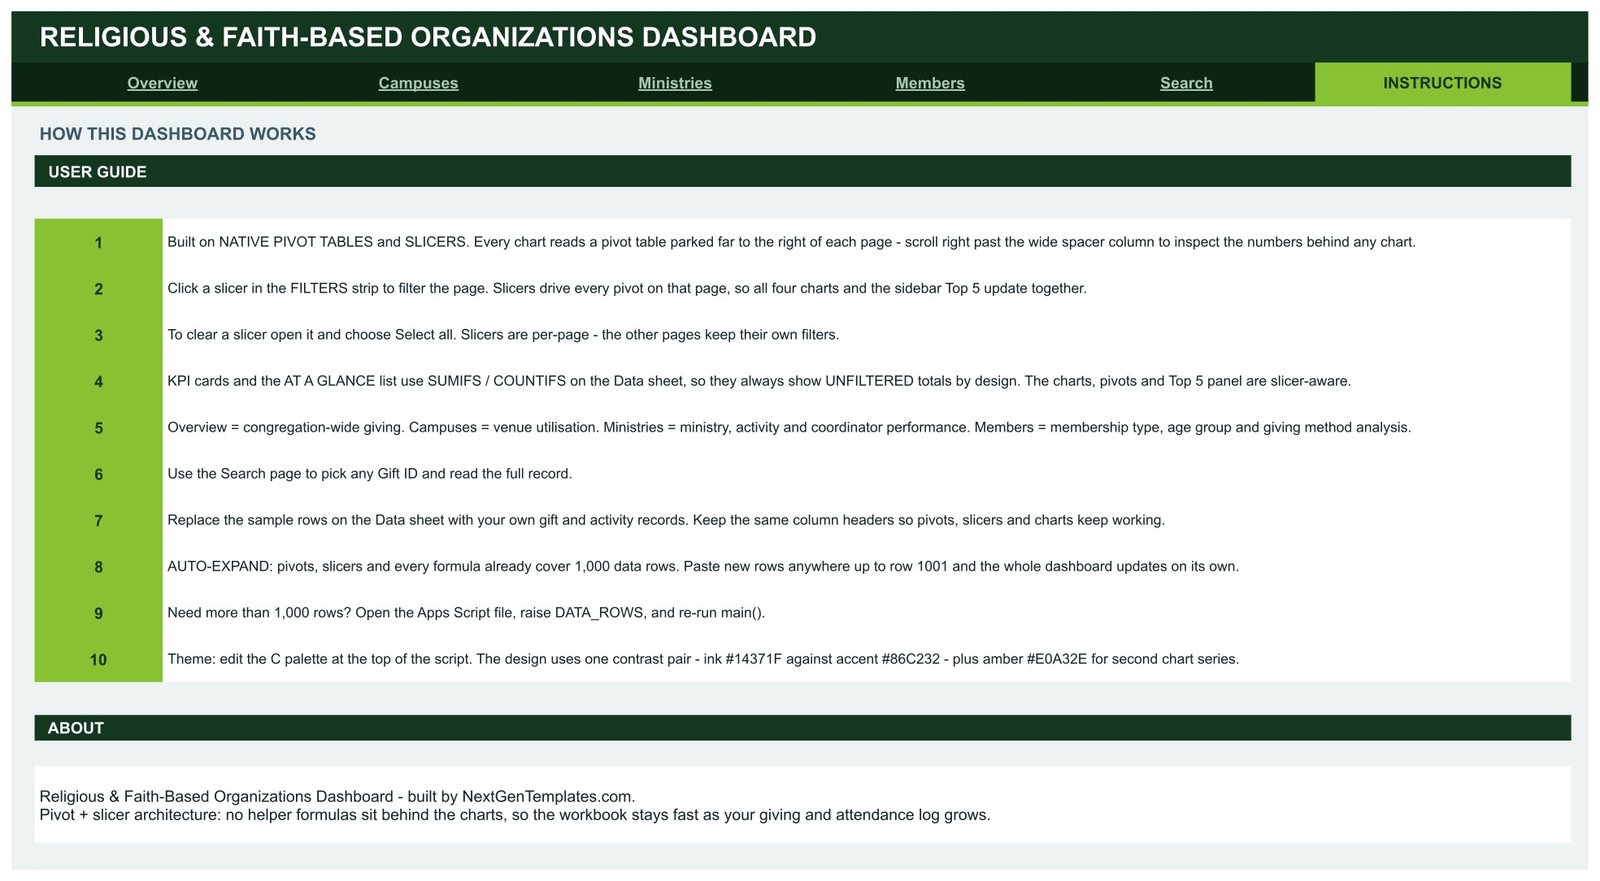
Page 6: Instructions – How the Dashboard Works
A ten-step user guide covering the pivot and slicer architecture, how to clear a slicer, why the KPI cards deliberately show unfiltered totals while the charts stay slicer-aware, how to paste your own data, and how to raise the 1,000-row ceiling or change the colour theme.
Religious & Faith-Based Organizations Dashboard vs. Excel vs. Paid Church Management SaaS – Feature Comparison
| Feature | Religious & Faith-Based Organizations Dashboard (Google Sheets) | Microsoft Excel Dashboard | Planning Center / Breeze ChMS / Tithe.ly |
|---|---|---|---|
| Cost | $9.99 one-time | $15-30 one-time, plus Microsoft 365 | $29-99 per month, tiered by member count |
| Platform | Any browser, no install | Excel desktop required for full fidelity | Vendor web app |
| Setup time | Under 10 minutes – paste your log | 15-30 minutes, refresh pivot caches | Days – import members, map fields, train staff |
| Real-time team collaboration | Yes, native Google Sheets sharing | Only via OneDrive co-authoring | Yes |
| Mobile access | Yes, Google Sheets app | Limited on Excel mobile | Yes |
| Customisable fields and labels | Yes – rename campuses, ministries, activity types | Yes | Restricted to vendor schema |
| Share with a link | Yes, view or edit link | File attachment or OneDrive link | Login required per user |
| Year-1 cost at 5 users | $9.99 total | $15-30 plus $500+ in licences | $348-1,188 |
| Who owns the data | You – it lives in your own Drive | You | Vendor, exportable on request |
For congregations that want campus, ministry and giving analytics without a per-month platform fee, the Religious & Faith-Based Organizations Dashboard sits in the sweet spot.
Who Should Use This Template
Perfect for:
- Church, mosque, temple and synagogue administrators running one to ten campuses
- Treasurers and finance volunteers who currently report giving from a plain spreadsheet
- Ministry coordinators who need attendance and activity numbers for a board or council meeting
- Faith-based non-profits reporting donations, volunteer drives and community meals to trustees
- Small teams already working in Google Workspace who do not want another login
Not a fit if:
- You need a full church management system with member portals, child check-in and automated pledge invoicing
- You process donations in-app and need payment gateway integration – this reports on giving, it does not collect it
- Your log exceeds tens of thousands of rows and needs a proper database rather than a spreadsheet
- You require tax-receipt generation or per-donor statutory statements out of the box
Real-World Use Cases
Miriam administers a three-campus congregation. Every Monday she pastes the weekend’s gift and attendance records into the Data sheet and opens the Campuses page. The Giving vs Attendance chart shows her immediately when a venue’s attendance is climbing while its giving is flat, which is the conversation she takes to the campus pastor rather than a spreadsheet full of raw rows.
Daniel is treasurer of a faith-based community charity. He uses the Members page to report the split between online giving, bank transfer, cash, cheque and text-to-give at the quarterly trustee meeting. The digital giving percentage on that page is the single number his board asks about, and it recalculates the moment new records land.
Grace coordinates nine ministries. Before each planning cycle she filters the Ministries page by coordinator and age group to see which programmes are drawing which demographic. The Attendance by Age Group chart is what tells her the youth programme needs a second volunteer, not a hunch.
Advantages of the Religious & Faith-Based Organizations Dashboard
- One log, not three. Giving, attendance and activity records share a single sheet, so every page reads from the same truth.
- Pivot architecture keeps it fast. Because no helper formulas sit behind the charts, the file does not slow down as records accumulate – a common failure mode in formula-heavy spreadsheet dashboards.
- Zero recurring cost. A one-time purchase replaces a subscription that scales with your member count.
- Genuinely editable. Campus names, ministry names, activity types and membership types are your labels, not a vendor’s fixed schema.
- Rebrand in one edit. The colour theme comes from three hex codes at the top of the bundled script.
Opportunities for Improvement
Worth knowing before you buy. The KPI cards and the At a Glance list use SUMIFS and COUNTIFS against the Data sheet, so they deliberately report unfiltered totals – only the charts, pivots and Top 5 panels respond to slicers. That is a design choice, and the Instructions page states it, but it surprises people who expect every number on screen to move when they click a slicer.
Slicers are also per-page: filtering the Campuses page does not filter the Ministries page. And the 1,000-row ceiling is generous for most congregations but not infinite – beyond that you need to raise DATA_ROWS in the Apps Script and re-run it. Finally, this is a reporting layer, not a donation processor; you still collect gifts wherever you collect them today.
Best Practices
- Keep the column headers exactly as shipped. Pivots, slicers and charts all bind to them by name.
- Enter one row per activity or gift, never a summary row – the pivots do the aggregating.
- Use consistent spelling for campus and ministry names. “Main Sanctuary” and “Main sanctuary” become two entries in every slicer.
- Set a weekly rhythm for pasting records rather than a monthly catch-up, so the Monthly Giving Trend chart is always current.
- Share the file with view access for trustees and edit access only for whoever maintains the log.
- If you need historical years side by side, keep one copy per year rather than stretching one file past its row ceiling.
If you are new to pivot tables and slicers in Sheets, Google’s own guide to creating and using pivot tables covers the underlying mechanics this dashboard is built on.
Explore Relevant Templates
- Church Finance Dashboard in Google Sheets – income, expenses and fund balances, the natural companion to this giving and attendance view. Read the full walkthrough.
- Religious & Faith-Based Organizations KPI Dashboard in Power BI – the same subject area for teams already standardised on Power BI.
- Donation Register Data Entry System in Excel – a form-driven way to capture gifts before they reach a dashboard.
- Fundraising Campaign KPI Dashboard in Google Sheets – campaign-level tracking for appeals and drives.
- Fundraising Event Calendar in Google Sheets – schedule the events this dashboard later measures.
Also available as: the Church Finance Dashboard ships in Excel, Power BI and HTML if your team works outside Google Sheets. Browse the full range of Google Sheets dashboards.
Want to build pivot-driven dashboards like this yourself? The Excel Pivot Tables & Dashboards course on NextGenTemplates Academy walks you through it with practice files.
Get the Religious & Faith-Based Organizations Dashboard in Google Sheets
Frequently Asked Questions
What does the Religious & Faith-Based Organizations Dashboard track?
The Religious & Faith-Based Organizations Dashboard tracks 16 KPIs across donations, attendance, campuses, ministries and members – including total donations, average gift value, gathering hours, worship giving, legacy donor giving, unique members and pledged rate. All of them recalculate when you replace the sample data.
How long does setup take?
Under ten minutes. Open the PDF in your download, click the Make a copy link to put the Religious & Faith-Based Organizations Dashboard in your own Google Drive, then paste your gift and attendance records over the sample rows on the Data sheet. Keep the column headers unchanged and every page updates itself.
How many records can it hold?
1,000 rows are covered by default – pivots, slicers and every formula already reach row 1001. To go further, open the bundled Apps Script file, raise the DATA_ROWS value and re-run main(). No formula editing is needed anywhere on the pages.
How does this compare to Planning Center or Breeze ChMS?
Those are full church management systems with member portals, check-in and payment processing, priced from roughly $29 to $99 per month. The Religious & Faith-Based Organizations Dashboard is a one-time $9.99 reporting layer over data you already keep. It analyses giving and attendance; it does not collect donations or manage members.
Do I need any add-ons or macros?
No. The Religious & Faith-Based Organizations Dashboard is built entirely on native Google Sheets pivot tables, slicers and charts. There is no add-on to install, no macro to enable and no subscription attached to the file once it is in your Drive.
Can I change the colours to match our organisation?
Yes. The theme is driven by three hex codes at the top of the included Apps Script – a dark ink, a green accent and an amber second-series colour. Change those three values, re-run the script, and the entire six-page dashboard is rebranded.
Why do the KPI cards not change when I click a slicer?
By design. The KPI cards and the At a Glance panels use SUMIFS and COUNTIFS against the Data sheet so they always show congregation-wide totals for reference. The charts, pivot tables and Top 5 panels on each page are slicer-aware and do respond to filtering.
About the Author
Built by PK – Microsoft Certified Professional with 15+ years of Excel, Google Sheets and Power BI experience. Founder of NextGenTemplates, reaching 300K+ subscribers across YouTube channels. Every template is hand-built and tested before release.
Conclusion
If your congregation’s giving, attendance and ministry records currently live in separate spreadsheets, the Religious & Faith-Based Organizations Dashboard in Google Sheets consolidates them into six pages you can hand to a board without reformatting anything. It is a one-time purchase, it runs in a browser, and it is yours to edit.
✅ Instant download · One-time payment · No subscription · Lifetime access
📅 Last updated: August 2026