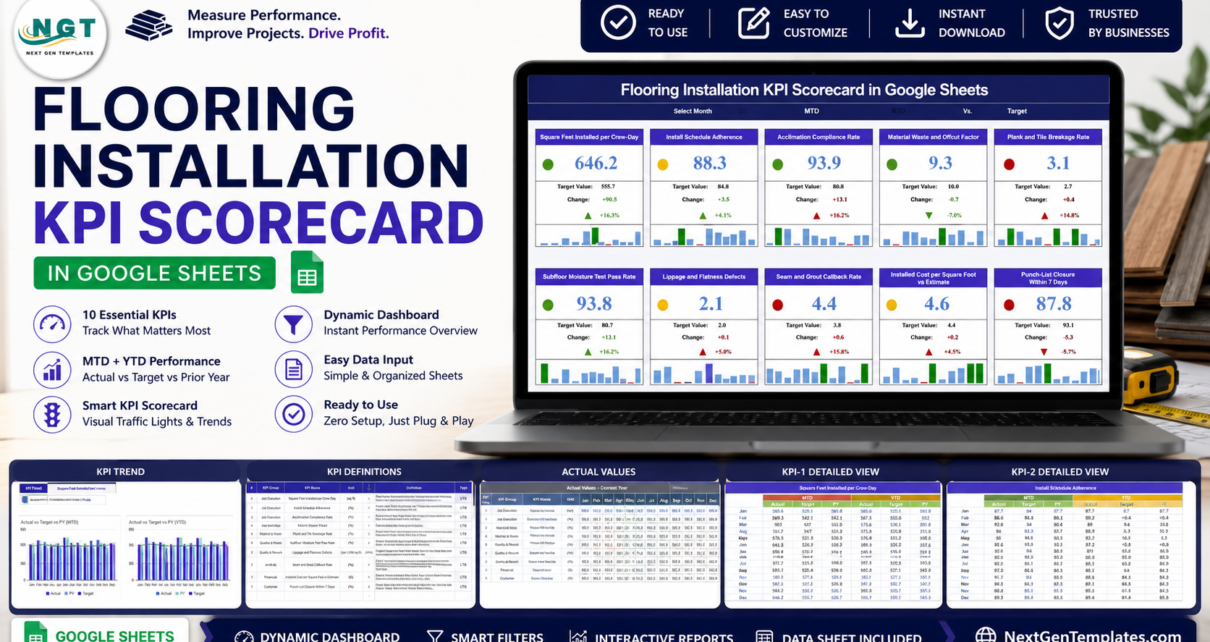
Most flooring contractors measure exactly one thing: square feet down. It is the number the crews talk about, the number the invoice is built on, and the number that hides everything else. The Flooring Installation KPI Scorecard in Google Sheets puts ten numbers next to each other instead of one – output, schedule, acclimation, waste, breakage, moisture, flatness, callbacks, installed cost and punch-list closure – and scores every one of them green, amber or red against that month’s target.Flooring Installation KPI Scorecard in Google Sheets
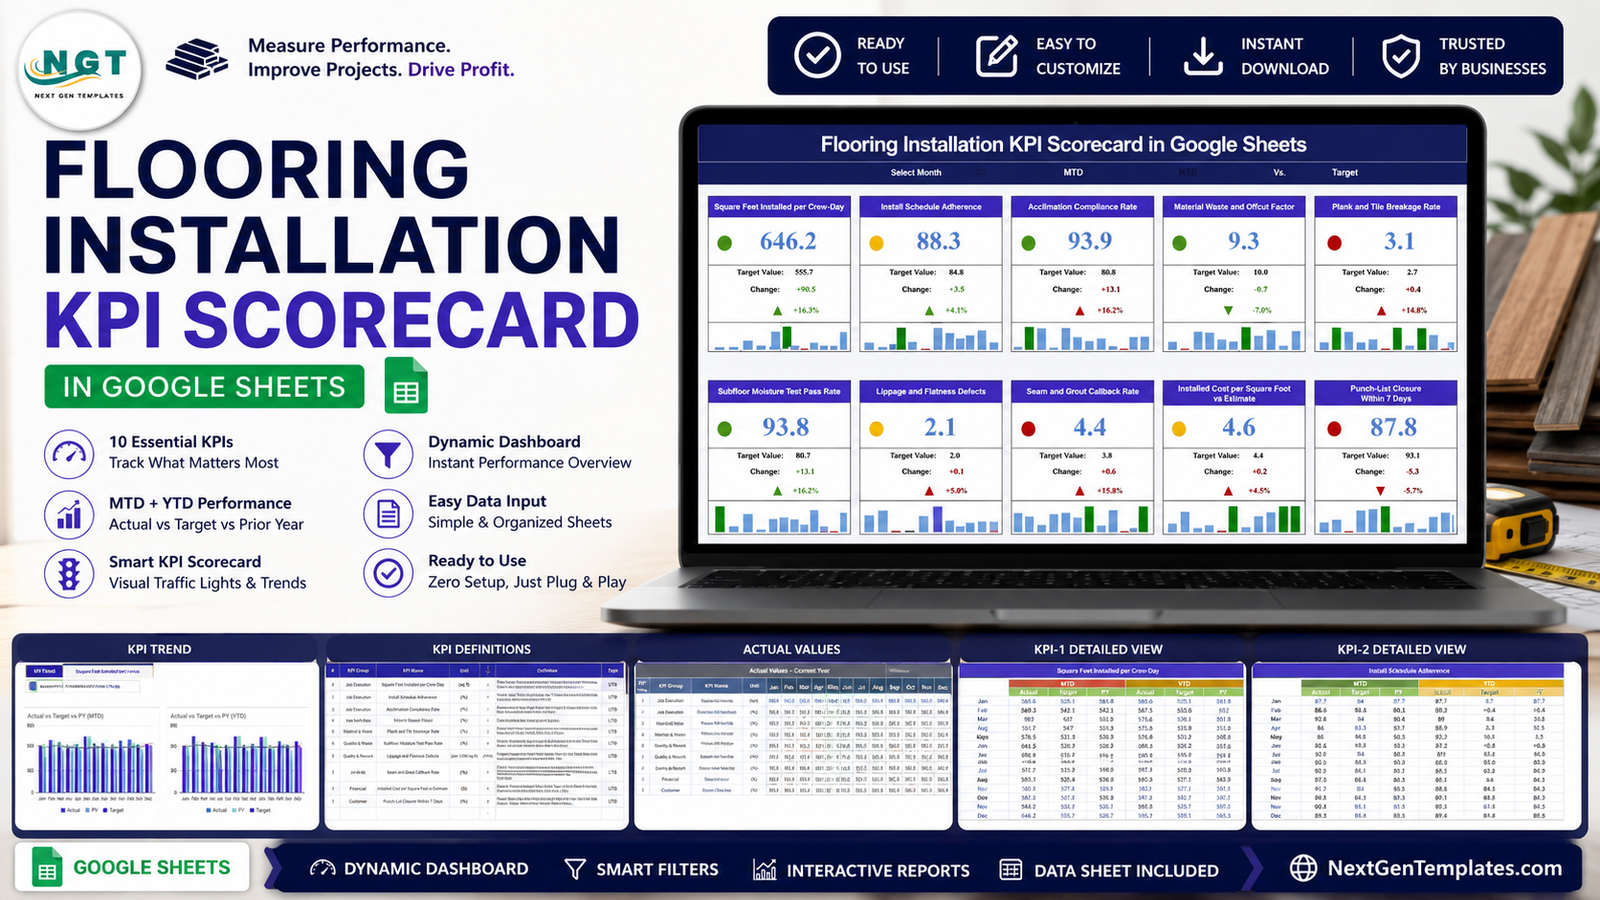
In the sample December month that board reads 4 green, 3 amber and 3 red. Square Feet Installed per Crew-Day is 646.2 against a 555.7 target, up 16.3% – a good month by the only measure most firms track. Two cards down, Plank and Tile Breakage Rate is 3.1% against a 2.7% target and Seam and Grout Callback Rate is 4.4% against 3.8%, both red. That is the whole argument for a scorecard in one screenshot: output was up and quality was slipping at the same time, and a single-number report would never have shown it.Flooring Installation KPI Scorecard in Google Sheets
This is four sheets of plain Google Sheets. No add-ons, no macros, no Apps Script to authorise, no monthly fee. It costs $8.99 on sale.Flooring Installation KPI Scorecard in Google Sheets
Get the Flooring Installation KPI Scorecard in Google Sheets
Key Features of the Flooring Installation KPI Scorecard in Google Sheets
- Ten KPIs in five groups – Job Execution, Material & Waste, Quality & Rework, Financial and Customer.Flooring Installation KPI Scorecard in Google Sheets
- Month picker – the “Select Month” control in the header moves the entire board from January to December.
- MTD or YTD basis – a second header control switches all ten cards between month-to-date and year-to-date.Flooring Installation KPI Scorecard in Google Sheets
- Compare against Target or prior year – a third control changes what every card is judged against.Flooring Installation KPI Scorecard in Google Sheets
- Traffic lights on every card – a green, amber or red dot, driven by that month’s target rather than a hard-coded threshold.
- Direction-aware scoring – each KPI is typed UTB (upper the better) or LTB (lower the better). Five of the ten here are LTB.Flooring Installation KPI Scorecard in Google Sheets
- Target, absolute change and percentage move – printed under every headline figure with an up or down arrow.
- Twelve-month mini bar chart in each card – the year’s shape without leaving the page.Flooring Installation KPI Scorecard in Google Sheets
- KPI Trend page – two full charts, Actual vs Target vs prior year on both MTD and YTD bases.Flooring Installation KPI Scorecard in Google Sheets
- KPI Definition sheet – group, unit, formula, plain-English definition and type for all ten.Flooring Installation KPI Scorecard in Google Sheets
- A single data sheet – one block per KPI, twelve monthly rows, six value columns. Type over the samples and everything recalculates.
Scorecard Pages Explained
1. KPI Scorecard
The front page, and the one that gets shared. A dark title bar runs across the top carrying the template name and the three dropdowns – Select Month, MTD/YTD and Vs. Target/PY. Underneath sit ten cards in two rows of five, each with a coloured status dot on the left, the headline number in large blue type, then a small block giving Target Value, Change and the percentage move with a green or red arrow, and finally a twelve-bar mini chart.Flooring Installation KPI Scorecard in Google Sheets
The ten cards on this build are Square Feet Installed per Crew-Day, Install Schedule Adherence, Acclimation Compliance Rate, Material Waste and Offcut Factor, Plank and Tile Breakage Rate, Subfloor Moisture Test Pass Rate, Lippage and Flatness Defects, Seam and Grout Callback Rate, Installed Cost per Square Foot vs Estimate, and Punch-List Closure Within 7 Days.
Worth reading carefully: Material Waste and Offcut Factor shows 9.3% against a 10.0% target, a change of -0.7 and -7.0%, and it is scored green. That is the LTB logic working – on a waste metric, down is a win, and the traffic light knows it. The same rule turns Punch-List Closure Within 7 Days at 87.8% against 93.1% into a red, because on that KPI down is a loss.Flooring Installation KPI Scorecard in Google Sheets
2. KPI Trend
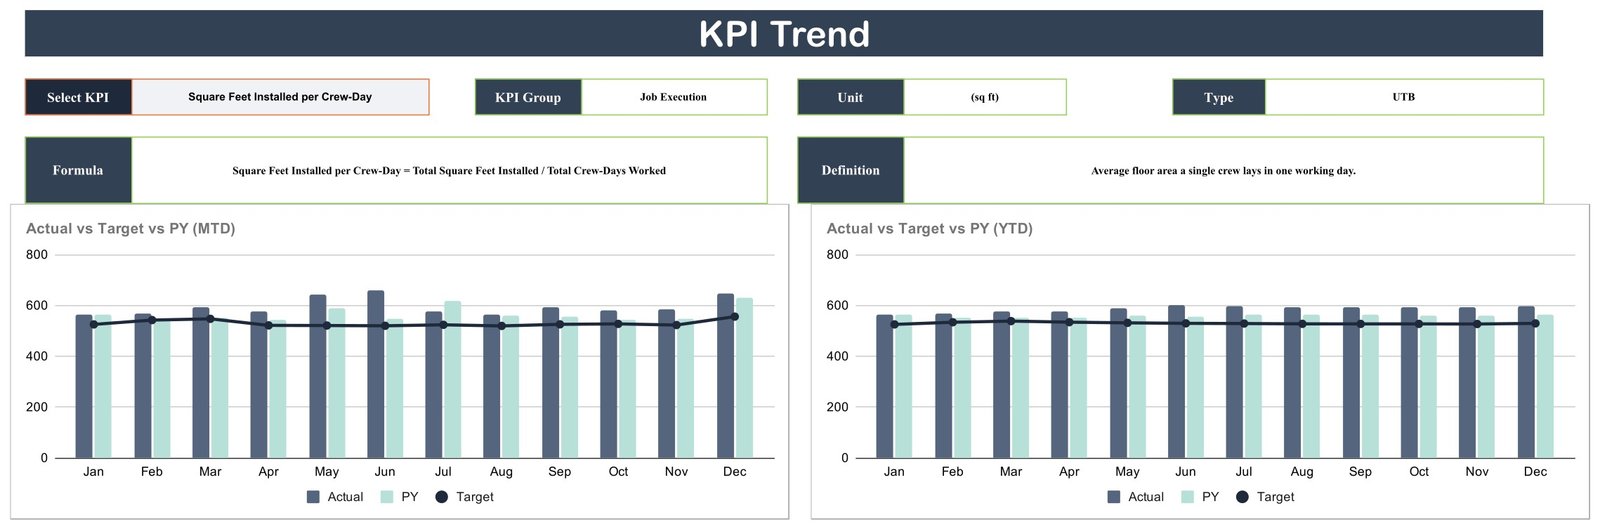
Pick a KPI from the “Select KPI” dropdown and the rest of the page fills itself in: KPI Group, Unit, Type, the formula and the definition, all read from the definition sheet. Below that sit two charts. The left one is Actual vs Target vs PY on an MTD basis across Jan-Dec; the right one is the same three series on a YTD basis. Actual and prior year are bars, target is a line drawn over them.
This is the page that tells you whether a red card is a trend or a bad month. In the sample data, Square Feet Installed per Crew-Day sits above the target line in every single month, with a spike in June and another in December – the kind of pattern that says the target is stale rather than the crews are heroic.
3. KPI Definition

A ten-row table with columns for number, KPI group, KPI name, unit, formula, definition and type. It is the sheet that stops two managers arguing about what a number means. Acclimation Compliance Rate, for example, is spelled out as jobs where material acclimated the full required hours divided by total jobs, times 100, and defined as the share of jobs where wood or vinyl sat on site for the manufacturer’s full acclimation period before install.
Units on this build are square feet, percentages, defects per 1,000 sq ft for Lippage and Flatness Defects, and dollars for Installed Cost per Square Foot vs Estimate. Change any of it – the definition sheet is where you make the template yours.
4. KPI Analysis (the data sheet)
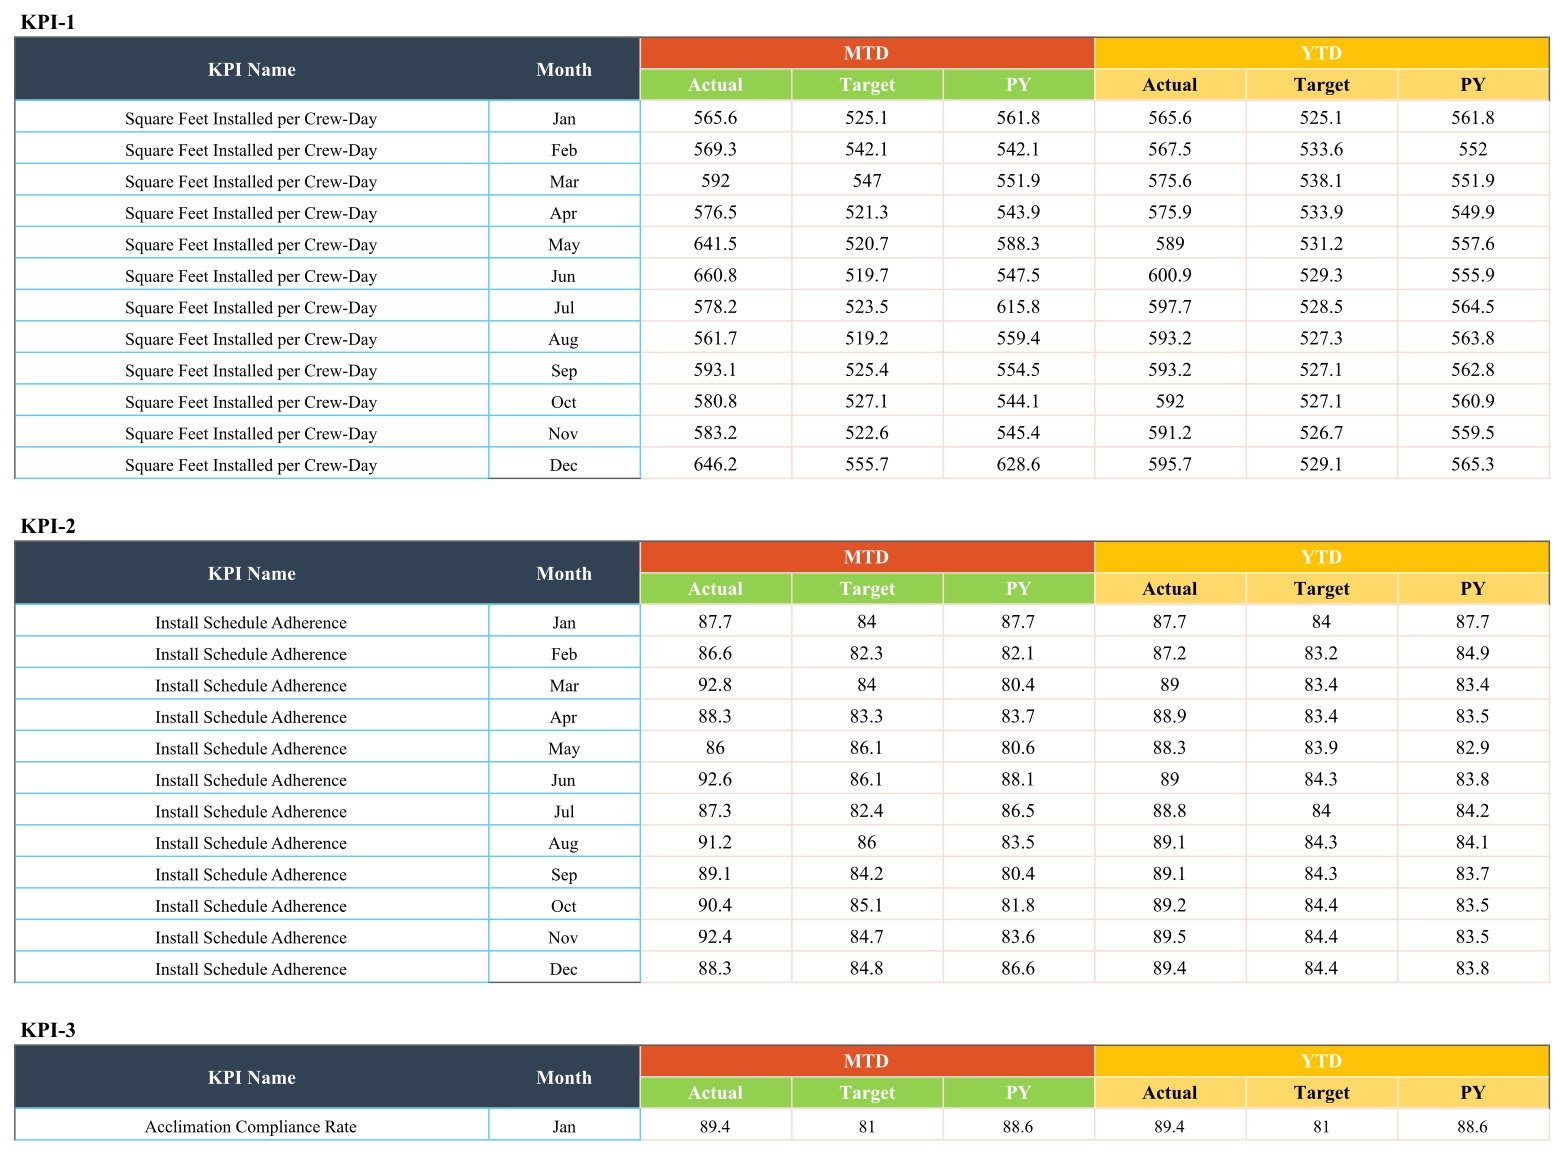
Every number in the file lives here. The sheet is built as a stack of blocks – KPI-1, KPI-2, KPI-3 and so on – and each block is a twelve-row table, January to December, with six value columns: MTD Actual, MTD Target, MTD PY, then YTD Actual, YTD Target and YTD PY. You type your figures into these blocks, month by month, and the scorecard and the trend charts follow.
Flooring Installation KPI Scorecard in Google Sheets vs. Excel vs. Paid Construction Software – Feature Comparison
| This scorecard (Google Sheets) | Excel KPI scorecard | Paid field-service / construction platform | |
|---|---|---|---|
| Cost | $8.99 once | $15-$20 once | $40-$120 per user per month |
| Platform | Any browser, plus the Sheets mobile app | Excel on desktop | Vendor web and mobile apps |
| Setup time | Copy the sheet and type your months in – under an hour | Comparable | Days to weeks with onboarding |
| Real-time collaboration | Native to Google Sheets | Via OneDrive co-authoring only | Yes |
| Mobile access | Read and edit in the Sheets app | Limited in Excel mobile | Purpose-built |
| Editable KPIs, formulas and targets | All ten, on the definition sheet | Yes | Often only on higher tiers |
| Share with a link | Yes | File or cloud link | Per-seat access |
| Year-1 cost at 5 users | $8.99 | $15-$20 plus Office licences | $2,400-$7,200 |
| Traffic-light scoring against target | All ten cards | Yes | Yes, usually configurable |
| Scheduling, dispatch, invoicing | No | No | Yes |
| Automatic data import | No – figures are typed in | No | Yes |
Who Should Use This Template
Flooring contractors running anywhere from two to twenty crews, where the numbers exist in someone’s head or in three separate spreadsheets but have never been put on one page. Installation managers who need a single sheet for the monthly owner’s meeting. Estimators who want to watch installed cost per square foot against the quoted rate. Quality leads chasing moisture, lippage and callback numbers over a full year rather than job by job.
It also suits a subcontractor who has to report performance to a general contractor or a national retail account and wants one clean page to send rather than a rebuilt slide deck every month.
Real-World Use Cases
The crew that looked best and was not. A 14-crew hardwood and LVP installer ranked crews on square feet alone. Once the breakage and callback KPIs sat on the same board, the highest-output crew turned out to carry the worst Plank and Tile Breakage Rate. Handling training went to that crew first instead of the slowest one.
The monthly review that got shorter. A tile and stone contractor now runs the review off two pages – the scorecard for the traffic lights, then KPI Trend for anything red. Reds get twelve months of context before anyone reacts, which killed the habit of chasing one unlucky month.
The estimate that was quietly wrong. A commercial flooring estimator watches one card, Installed Cost per Square Foot vs Estimate, sitting at $4.6 against a $4.4 target. The mini bar chart inside the card showed the overrun in most months, not one – so the rates got rebuilt rather than the job blamed.
Advantages of the Flooring Installation KPI Scorecard in Google Sheets
- Everything on one screen. Ten KPIs, ten traffic lights, no scrolling, no clicking through tabs to find the bad news.
- Targets, not thresholds. Scoring is done against the target you typed for that month, so a seasonal business can move its targets without breaking the colours.
- Lower-is-better handled properly. Waste, breakage, lippage, callbacks and cost variance all score correctly instead of showing red every time they improve.
- Trend and detail are one click away. The card gives the twelve-month shape, the KPI Trend page gives the full comparison, the definition sheet gives the formula.
- Nothing to install and nothing to renew. It runs in a browser on Windows, Mac, Chromebook, iPad or Android, and one payment is the whole cost.
- Shareable the way Sheets is shareable. Send a view-only link to a client or an edit link to the office – no seats, no licences.
Opportunities for Improvement
Being straight about the limits, because they matter before you buy:
- Data is typed in. Nothing here connects to estimating, accounting or field-service software, and there is no import routine. Somebody enters twelve months of figures per KPI.
- Ten cards is the layout. The scorecard is drawn as two rows of five and the data sheet has one block per KPI. An eleventh KPI means extending both sheets by hand.
- No alerts or notifications. The sheet colours a dot; it does not email anyone, and nothing fires when a KPI turns red.
- One year at a time. The structure is twelve months plus a prior-year column. Multi-year history means a second copy or an extended data sheet.
- The sample data is invented. Every figure in the file is demonstration data. Treat the KPI names and targets as a starting point, not a benchmark.
Best Practices
- Fix the definitions before you enter a single number. Decide what counts as a callback and what counts as a punch item, write it into the definition sheet, and everyone reads the same board.
- Set the UTB/LTB type first. If you swap a KPI, the type is what tells the traffic lights which direction is good. Get it wrong and the whole card lies.
- Enter targets monthly, not annually. A flat annual target makes winter look like a failure. Per-month targets are what the scorecard is built for.
- Read MTD and YTD together. One red month against eleven green ones is noise; the YTD view says whether it is.
- Check the trend page before acting on a red. Two clicks, and it will often show the target rather than the crew is the problem.
- Keep one copy per year and lock the old one. Google Sheets version history is good, but a clean archived copy is better for a year-on-year comparison. Google’s guide to version history in Sheets covers how to name and restore versions.
Explore Relevant Templates
If you want the same trade covered at a different depth or on a different platform, the Flooring and Tiles KPI Dashboard in Excel and the Flooring and Tiles KPI Dashboard in Power BI are separate builds with their own KPI sets, and the Flooring and Tiles Dashboard in Excel is the analytical version – charts and slicers rather than a scorecard.
For the operational side – jobs, customers, quotes – look at the Carpet and Flooring Business Management System Web App or the Construction Project Management System Web App. Staying in Google Sheets, the Construction Dashboard in Google Sheets, the Renovation Request Tracker in Google Sheets and the Home Renovation Budget and Project Tracker in Google Sheets all sit alongside this one. To see the identical scorecard format on another industry, try the Solar Energy KPI Scorecard in Google Sheets, or browse the whole Google Sheets KPI Dashboard category.
Want to build skills like this step by step? The Excel Pivot Tables & Dashboards course on NextGenTemplates Academy walks you through the reporting side with practice files.
Get the Flooring Installation KPI Scorecard in Google Sheets
Frequently Asked Questions
Is this the same product as the Flooring and Tiles KPI Dashboard?
No. This is the scorecard line: a month-picker board of KPI cards with traffic lights, a KPI Trend page, a KPI Definition sheet and one data sheet. The Flooring and Tiles KPI Dashboard is a different build with a different KPI set, and it covers the flooring and tiles trade generally rather than installation performance specifically.
Do I need Excel, or any add-on?
No. It is plain Google Sheets. Open it in any browser on any operating system. There are no macros, no add-ons and no Apps Script permissions to grant.
Does it pull figures from my job management system?
No. The KPI Analysis sheet is filled in by hand or pasted from a report you already produce. Nothing in the file connects to estimating, accounting or field-service software.
Can I change the ten KPIs?
Yes. Rename any KPI on the definition sheet, change its unit, rewrite the formula text and set your own monthly targets. Set the UTB/LTB type to match the new metric, because that is what drives the traffic lights.
Can I track more than ten KPIs?
The scorecard is laid out for ten cards in two rows of five and the data sheet has one block per KPI, so an eleventh means extending both sheets manually. It is normal spreadsheet work, but it is not a setting.
Is the sample data real flooring data?
No. It is demonstration data so the charts and traffic lights have something to draw. Clear it and enter your own.
Will this prove my installations meet manufacturer or industry requirements?
No. The sheet records numbers you type. Moisture-test pass rates, acclimation compliance and flatness readings here are internal management measures – they are not certification, warranty evidence or a compliance record.
How do I get my own copy?
The download is a PDF containing a “Make a copy” link. Click it and Google Sheets creates an editable copy in your own Drive. The original file is never touched.
About the Author
Built by PK – Microsoft Certified Professional with 15+ years of Excel, Google Sheets, and Power BI experience. Founder of NextGenTemplates, reaching 300K+ subscribers across YouTube channels. Every template is hand-built and tested before release.
Conclusion
Square feet per crew-day tells you how fast you are going. It tells you nothing about how much material you scrapped getting there, how many seams you are going back for, or whether the installed cost matched the estimate. The Flooring Installation KPI Scorecard in Google Sheets puts all ten of those numbers on one page, scores each against its own target with the right direction logic, and gives you a twelve-month trend for any of them in two clicks. Four sheets, one payment, no subscription.
Get the Flooring Installation KPI Scorecard in Google Sheets – instant download, $8.99 on sale from $13.99.