Most painting contractors already know their revenue. Far fewer can say, without digging, whether surface-prep rework got worse last quarter, how many square feet a crew actually coats in a day, or what share of handed-over jobs pulled a painter back for touch-ups. Those answers live in punch lists, job folders and someone’s memory – not on a page you can put in front of a foreman.Painting Contractor KPI Scorecard in Google Sheets
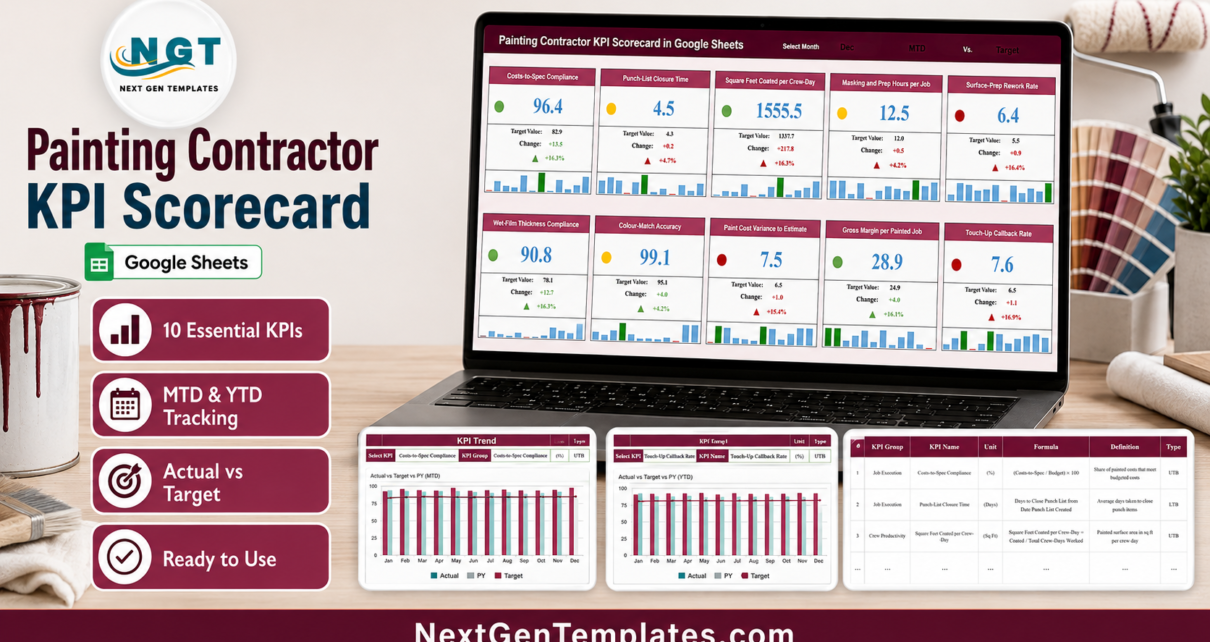
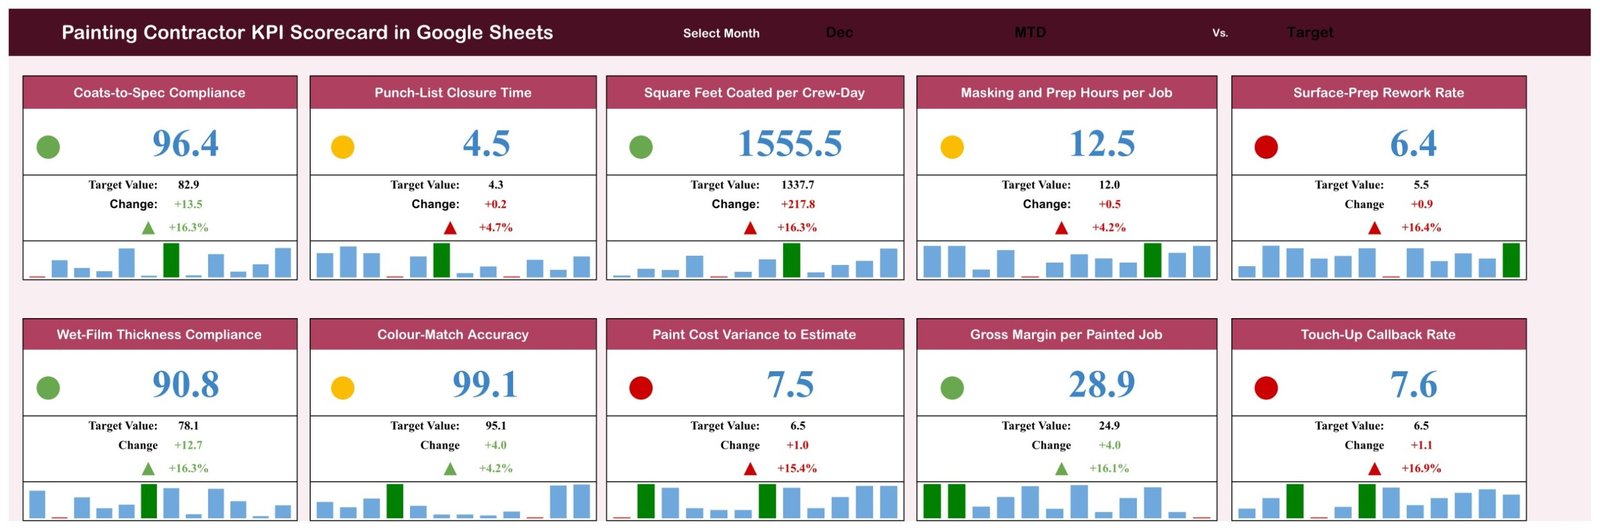
The Painting Contractor KPI Scorecard in Google Sheets is that page. Ten painting KPIs, grouped five ways, each scored green, amber or red against that month’s target. In the sample December built into the file, four KPIs land green, three amber and three red: Coats-to-Spec Compliance at 96.4 against a target of 82.9, Square Feet Coated per Crew-Day at 1,555.5 against 1,337.7, and Touch-Up Callback Rate at 7.6 against a target of 6.5. Change the month in one dropdown and all ten cards, all ten arrows and all ten mini charts redraw.Painting Contractor KPI Scorecard in Google Sheets
Get the Painting Contractor KPI Scorecard in Google Sheets
Key Features of the Painting Contractor KPI Scorecard in Google Sheets
- 10 KPIs in 5 groups. Job Execution (Coats-to-Spec Compliance, Punch-List Closure Time), Crew Productivity (Square Feet Coated per Crew-Day, Masking and Prep Hours per Job), Quality and Rework (Surface-Prep Rework Rate, Wet-Film Thickness Compliance, Colour-Match Accuracy), Financial (Paint Cost Variance to Estimate, Gross Margin per Painted Job) and Customer (Touch-Up Callback Rate).Painting Contractor KPI Scorecard in Google Sheets
- A single month picker. One Select Month control drives the whole board.
- A comparison switch. The banner also sets the basis – MTD or YTD – and the benchmark – Target or PY – so the same ten cards can be read four ways.Painting Contractor KPI Scorecard in Google Sheets
- Direction-aware traffic lights. Every KPI is tagged UTB (upper-the-better) or LTB (lower-the-better), so a rising Punch-List Closure Time is scored as a slip while a rising Gross Margin is scored as a win.
- Target, change and percentage move on every card, with a coloured triangle. December’s Colour-Match Accuracy moves +4.2% and shows amber; Surface-Prep Rework Rate moves +16.4% the wrong way and shows red.
- A twelve-month bar strip inside each card, with the selected month highlighted, so a single bad month never gets mistaken for a trend.Painting Contractor KPI Scorecard in Google Sheets
- A KPI Trend page and a KPI Analysis page behind the board.
- One monthly data sheet – no hidden helper tabs to maintain.Painting Contractor KPI Scorecard in Google Sheets
Dashboard Pages Explanation
1. KPI Scorecard
Ten cards in two rows of five, under a banner carrying the month picker and the comparison switch. Each card shows the KPI name, a coloured status dot, the month’s value in large type, the target value, the absolute change, the percentage move with an arrow, and the twelve-month bar strip. Nothing scrolls; the whole month fits on one screen.
2. KPI Trend
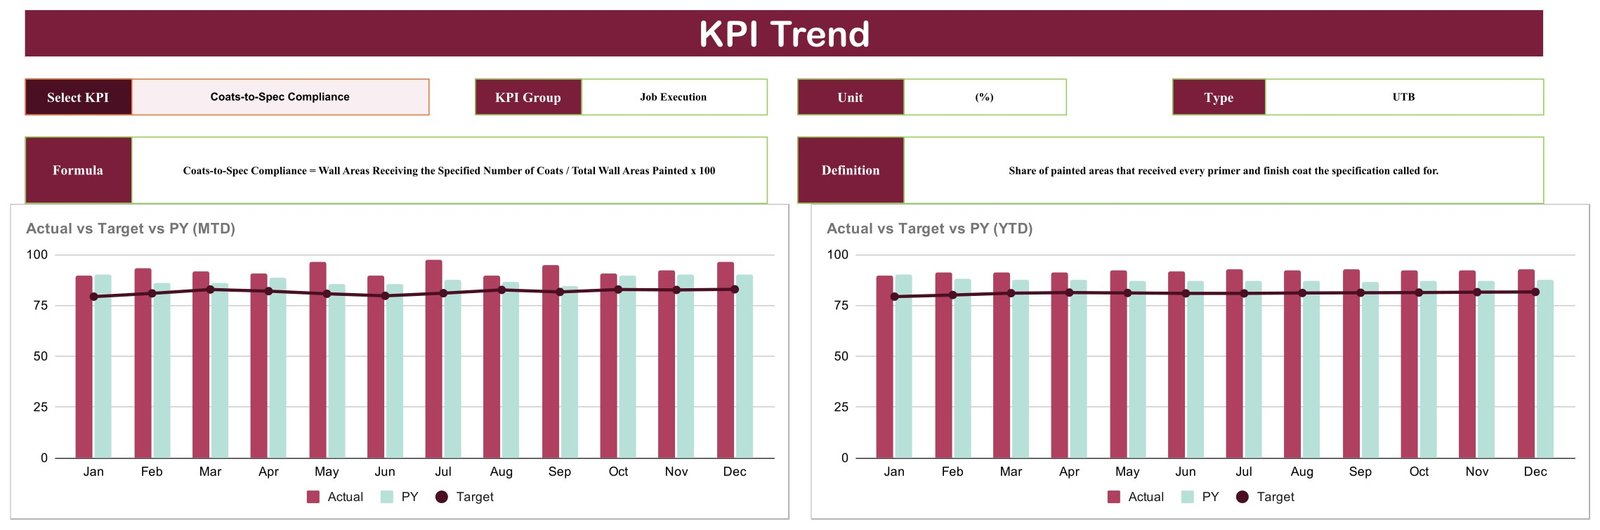
Choose one KPI from the dropdown and the page fills in its group, unit and direction type, then prints the exact formula and a plain-English definition. Coats-to-Spec Compliance, for example, is defined as wall areas receiving the specified number of coats divided by total wall areas painted, times one hundred – “the share of painted areas that received every primer and finish coat the specification called for”. Underneath sit two charts: Actual vs Target vs PY on an MTD basis, and the same three series on a YTD basis, January through December.Painting Contractor KPI Scorecard in Google Sheets
3. KPI Analysis
The reference table for the entire scorecard: number, KPI group, KPI name, unit, formula, definition and type for all ten KPIs. Seven of the ten are percentages; the others are days, square feet and hours. This is the page to hand a new foreman, because it settles what each term means before anyone argues about a number.Painting Contractor KPI Scorecard in Google Sheets

4. Data
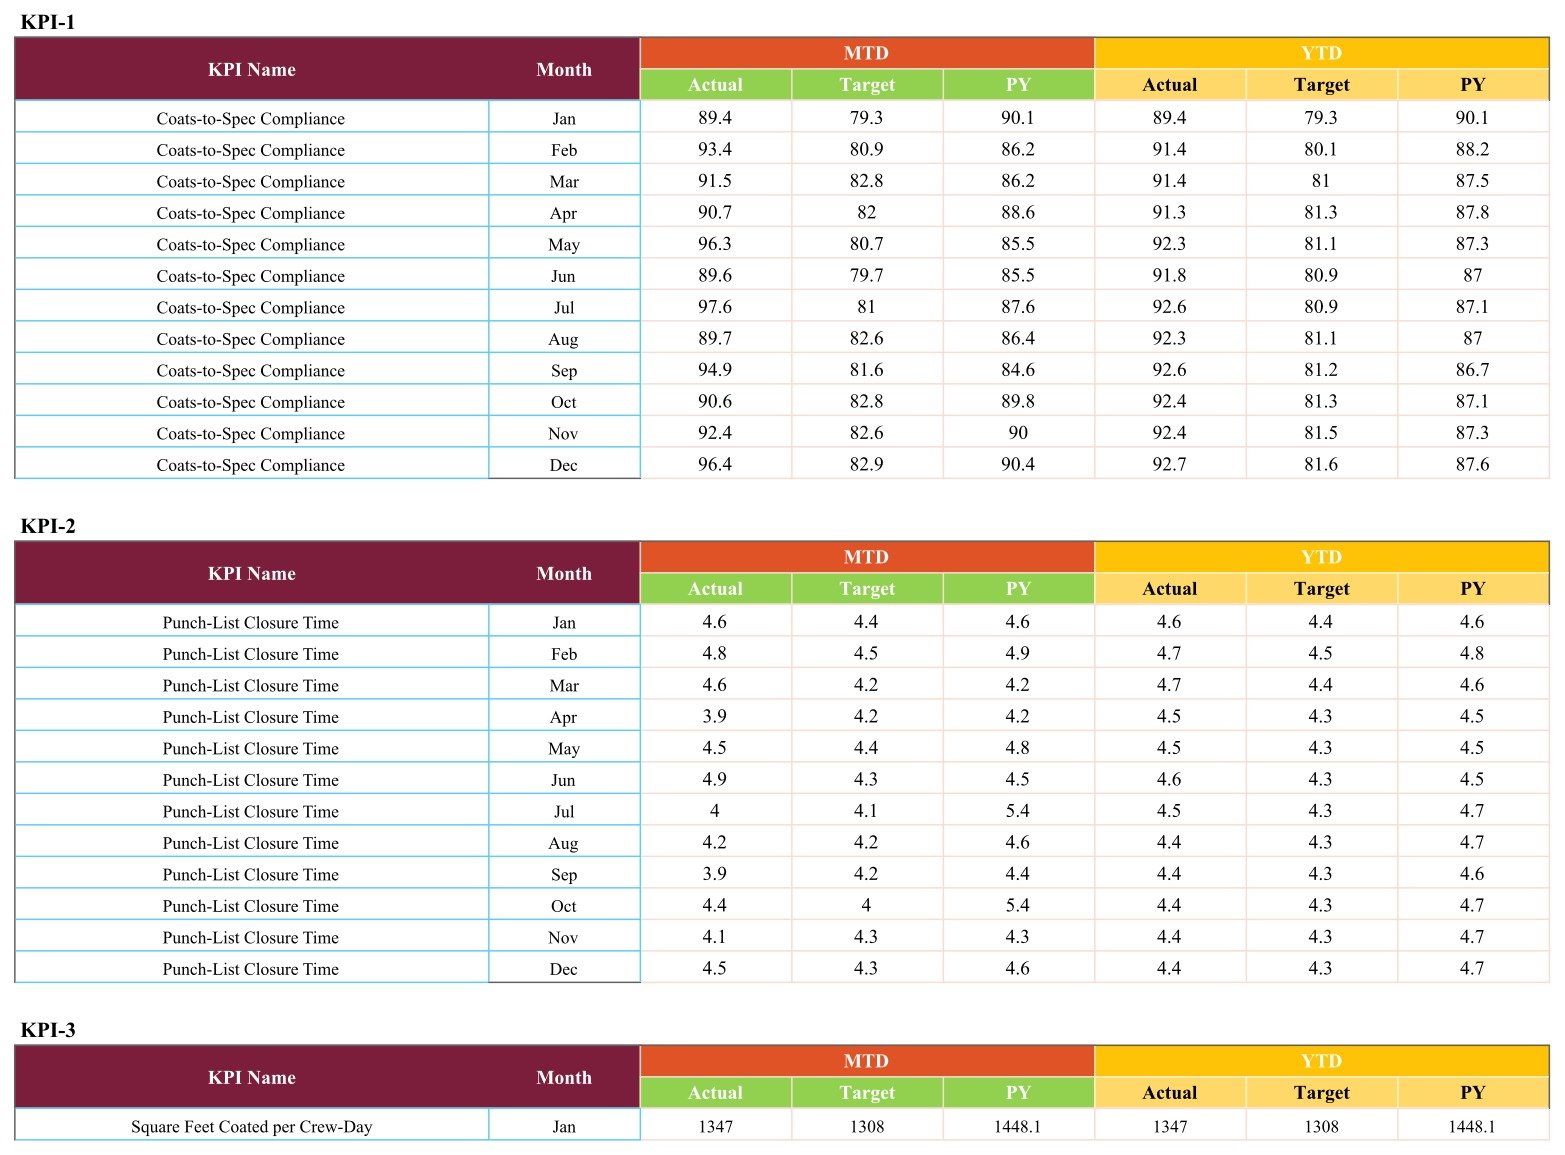
One sheet, ten blocks, twelve rows each. Every row carries the MTD Actual, Target and PY alongside the YTD Actual, Target and PY. You type the month’s figures here and everything above updates – there is no import step and no connector.
Painting Contractor KPI Scorecard vs. an Excel Scorecard vs. Paid Field-Service SaaS – Feature Comparison
| This Google Sheets scorecard | An Excel KPI scorecard | Paid field-service / job-costing SaaS | |
|---|---|---|---|
| Cost | One-time purchase | One-time purchase | Per-user subscription |
| Platform | Google Sheets, any browser | Microsoft Excel desktop | Vendor web app plus mobile |
| Setup time | Copy the file, replace one month – under an hour | Open the workbook, replace the sample data | Onboarding, migration and crew training |
| Real-time team collaboration | Yes, native to Google Sheets | Only via a shared drive or Microsoft 365 | Yes |
| Mobile access | Google Sheets mobile app | Excel mobile app | Yes, purpose-built |
| Customisable KPIs | Rename, re-target and re-direct any of the 10 | Yes | Limited to vendor fields |
| Share with a link | Yes | No – you send a file | Yes, inside the licence |
| Year-1 cost at 5 users | The purchase price, once – no per-seat fee | The purchase price, once | Scales with headcount |
| Traffic-light scoring | Yes, direction-aware on all 10 | Yes | Usually, on reporting plans |
| Where the numbers come from | Typed into the Data sheet monthly | Typed in | Captured from crew job entries |
Who Should Use This Template
It suits residential and commercial painting contractors with roughly two to twenty crews – big enough that the owner cannot hold every job in their head, small enough that a subscription platform is hard to justify. It works for an owner-operator who reviews the month with a foreman, an operations lead reporting to partners, and an estimator-turned-manager who has been asked for “a KPI report” and does not want to build one from scratch.
It is not the right tool if you need live data. There is no link to accounting, estimating or field-service software, nothing imports automatically, and nothing alerts you when a KPI turns red. It is a monthly reporting layer, not an operational system.
Real-World Use Cases
The monthly crew review. An eleven-painter residential firm used to open its month-end meeting with a stack of punch lists. Now the scorecard opens it: Surface-Prep Rework Rate red at 6.4 against a 5.5 target, so prep gets the hour instead of a general discussion about “quality”.
The partner report. A commercial painting firm’s operations lead reports to two partners who care about margin and productivity. Gross Margin per Painted Job and Square Feet Coated per Crew-Day sit side by side with twelve-month strips underneath, which ended the requests for extra spreadsheets.
The handover. A second-generation owner used the KPI Analysis page as the shared definition sheet for three foremen, so “callback” and “rework” meant the same thing to everyone before targets were ever discussed.
Advantages of the Painting Contractor KPI Scorecard
- It is finished. Ten trade-specific KPIs with formulas and definitions already written – no blank template to fill in.
- Direction is handled for you. LTB KPIs such as Paint Cost Variance to Estimate are not punished for being small, and UTB KPIs are not rewarded for it.
- One page, one meeting. The whole month fits above the fold, which is what makes people actually look at it.
- Nothing to install. No macros, no add-ons, no Apps Script authorisation prompt – a free Google account is enough.
- Everything is editable. KPI names, formula text, targets and direction types are all plain cells.
Opportunities for Improvement
Two things are worth saying plainly. First, data entry is manual – twelve months per KPI, typed on the Data sheet. If you want automation, you would need to add your own import from whatever system holds the source figures. Second, the scorecard is monthly by design; there is no weekly or per-job view, and no crew-level or branch-level breakdown. Contractors who want per-job costing will need a job-costing tool alongside this, not instead of it.
One layout note from the screenshots: on the Data page the KPI blocks are stacked one under another, so reviewing a KPI at the bottom of the sheet means a long scroll. Using the KPI Trend page for single-KPI review is faster.
Best Practices
- Set targets before you set colours. Load a full prior year into the PY columns first, then set targets that are a stretch on the actual baseline rather than a round number.
- Agree the definitions once. Walk the KPI Analysis page with your foremen before the first review, and edit the wording to match how your crews already talk.
- Check the direction type on anything you rename. A renamed KPI keeps whatever UTB/LTB tag it had, and a wrong tag flips the traffic light.
- Read amber as “look”, not “fine”. In the sample month, three KPIs sit amber on moves under five percent – the size of the gap is on the card for a reason.
- Share view-only. Use Google’s own sharing controls so foremen can see the scorecard without editing targets.
- Keep one file per year. Copy the sheet each January rather than overwriting, so last year’s board stays readable.
Explore Relevant Templates
The same scorecard engine ships for other industries – see the Solar Energy KPI Scorecard in Google Sheets, the Wind Energy KPI Scorecard in Google Sheets and the Hydropower KPI Scorecard in Google Sheets.
For the project side of contracting rather than the reporting side, the Home Renovation Budget and Project Tracker in Google Sheets and the Architecture and Design Dashboard in Google Sheets are the natural companions.
Curious how a scorecard like this is put together? The Excel Pivot Tables & Dashboards course on NextGenTemplates Academy covers the underlying reporting skills, with practice files.
Get the Painting Contractor KPI Scorecard in Google Sheets
Frequently Asked Questions
Is this the KPI Scorecard or the KPI Dashboard?
The KPI Scorecard. It is a month picker, ten KPI cards with traffic lights, a KPI Trend page, a KPI Analysis page and one monthly data sheet. The KPI Dashboard line and the analytical Dashboard line are different templates with different layouts, and several carry similar names.
Does it connect to my accounting or job-management software?
No. There is no connector and no automatic import. You enter the monthly figures yourself, which is why it works regardless of what software you already run.
Can I change the KPIs?
Yes – rename any KPI, edit its formula and definition text, set your own targets, and switch it between upper-the-better and lower-the-better so the traffic light scores it correctly.
Does it send alerts when something goes red?
No. Nothing emails, notifies or reminds. The card colour changes the next time you open the sheet.
Do I need a paid Google Workspace plan?
No. A free Google account is enough, and there are no add-ons or macros to enable.
Is the sample data real?
No – the twelve months in the file are demonstration figures so the charts and traffic lights have something to draw. Replace them with your own.
About the Author
Built by PK – Microsoft Certified Professional with 15+ years of Excel, Google Sheets, and Power BI experience. Founder of NextGenTemplates, reaching 300K+ subscribers across YouTube channels. Every template is hand-built and tested before release.
Conclusion
A painting business does not fail because nobody looked at revenue. It leaks – through re-sanded walls, punch lists that stay open, crews that cover less than they should, and paint spend that quietly overruns the estimate. The Painting Contractor KPI Scorecard in Google Sheets puts those ten leaks on one page and colours them against a target you set, month by month.
Get the Painting Contractor KPI Scorecard in Google Sheets – it is a one-time purchase, opens in any browser, and needs one month of numbers before it starts earning its keep.