Managing architectural projects requires constant tracking of various key performance indicators (KPIs) to ensure that your projects meet targets, deadlines, and quality standards. With the Architecture KPI Dashboard in Google Sheets, you can efficiently track and visualize the performance of your architecture projects. This dashboard is a ready-to-use template built to help architects monitor critical data, ensuring projects stay on track.
In this article, we will explore the key features, advantages, opportunities for improvement, and best practices for using the Architecture KPI Dashboard in Google Sheets. Additionally, we’ll delve into the KPIs you need to track and provide insights on how to make the most out of this powerful tool.
What is the Architecture KPI Dashboard in Google Sheets?
The Architecture KPI Dashboard in Google Sheets is a customizable tool that helps architects track key performance indicators (KPIs) related to their projects. This dashboard is built within Google Sheets, making it easy to use, accessible anywhere, and perfect for collaboration.
The template provides a comprehensive view of multiple architectural KPIs, which are displayed in various tabs within the sheet. These KPIs can help you track project progress, monitor budget adherence, evaluate performance, and compare data against previous years.
Key Features of the Architecture KPI Dashboard
The Architecture KPI Dashboard is made up of six key worksheets:
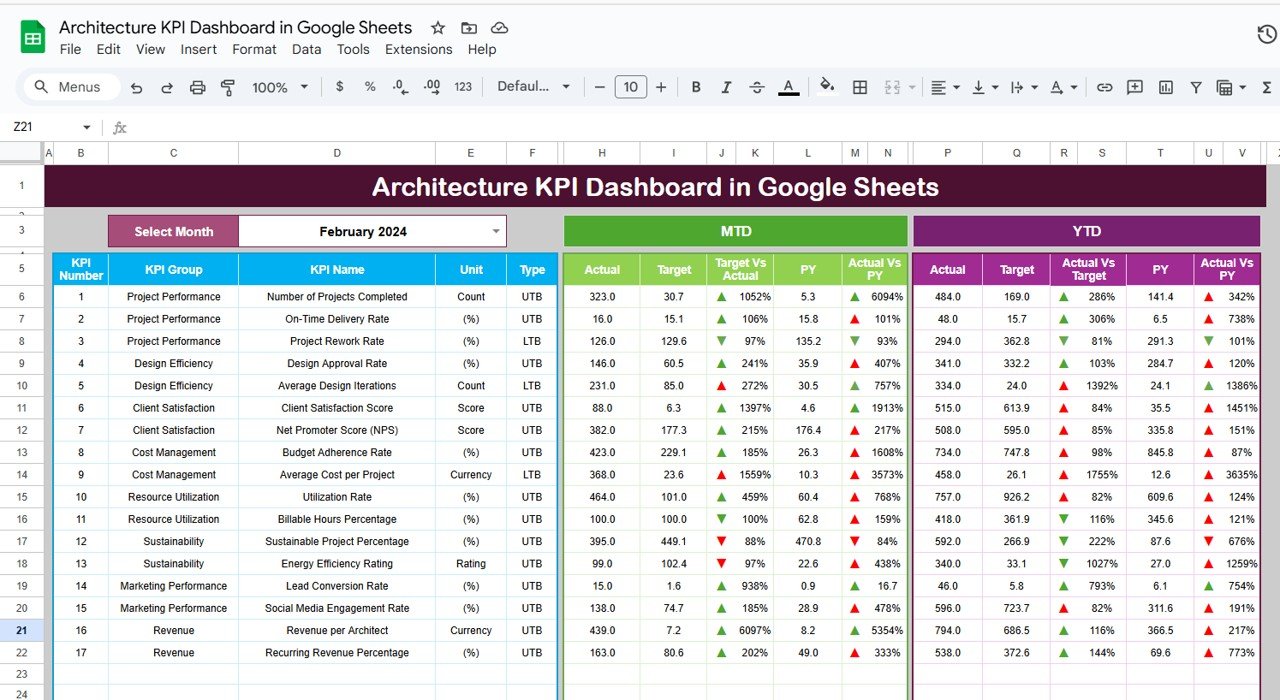
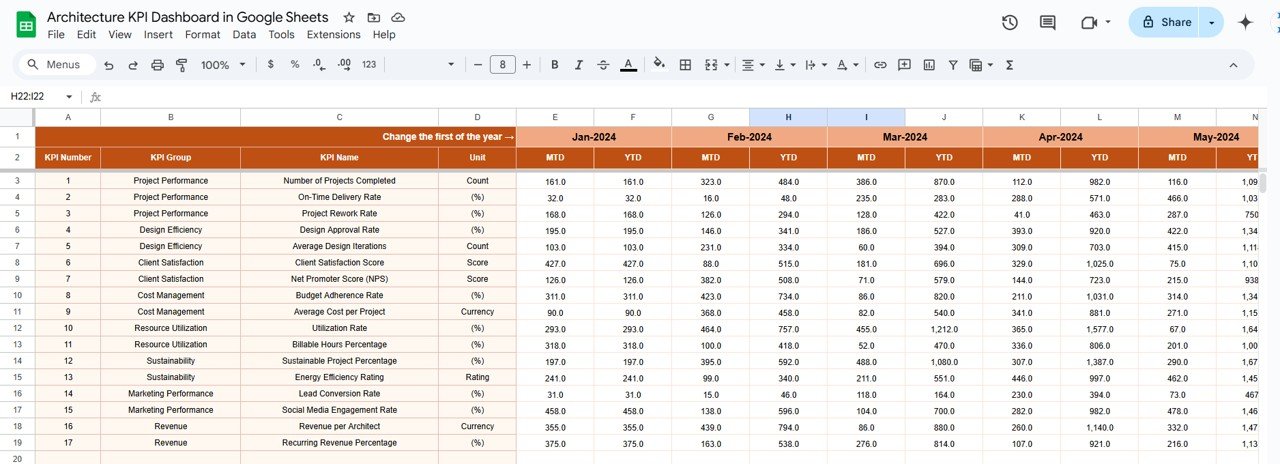
1. Dashboard Sheet Tab
The main sheet provides an overview of the KPIs, including:
-
MTD (Month-To-Date) Actual, Target, and Previous Year data.
-
YTD (Year-To-Date) Actual, Target, and Previous Year data.
-
Conditional formatting with up and down arrows to easily see how your data compares to targets.
You can select a specific month from a dropdown in range D3, which will automatically update all the data for that month.
Click to buy Architecture KPI Dashboard in Google Sheets
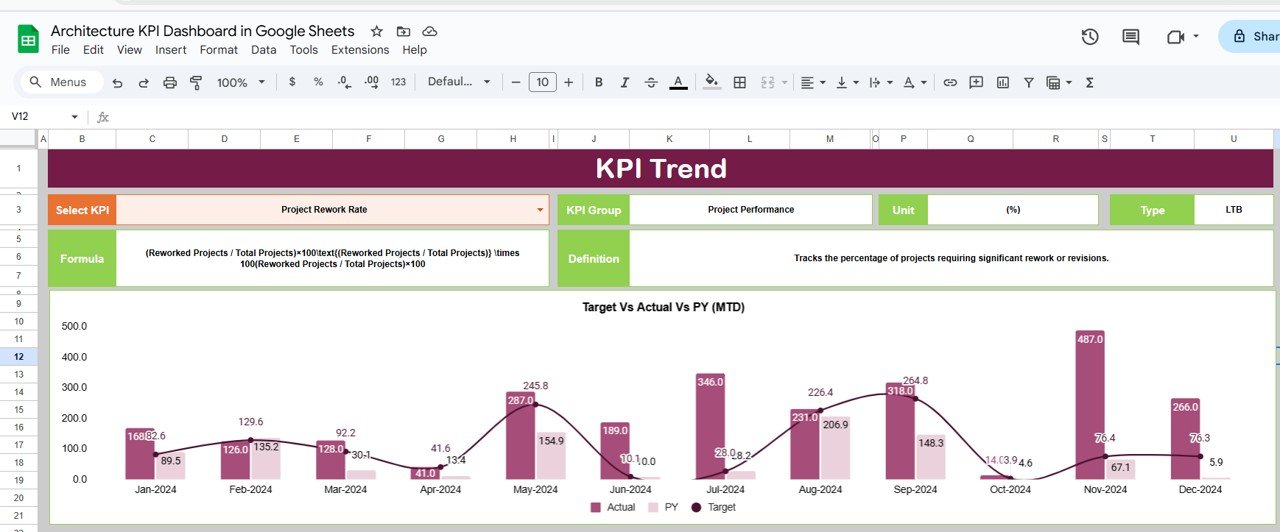
2. KPI Trend Sheet Tab
Here, you can select any KPI from a dropdown (range C3), and the dashboard will display:
-
KPI Group
-
Unit of measurement
-
KPI Type (whether ‘Lower the Better’ or ‘Upper the Better’)
-
Formula for calculating the KPI
-
Definition of the KPI
This tab provides detailed insights into each KPI and how it’s calculated.
Click to buy Architecture KPI Dashboard in Google Sheets
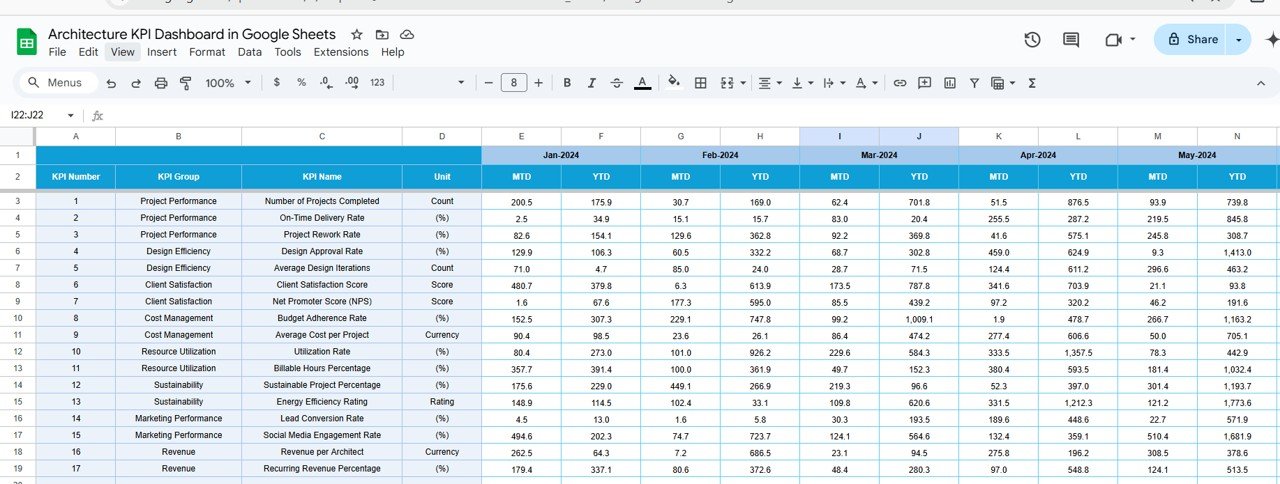
3. Actual Numbers Sheet Tab
In this tab, you will enter actual data for MTD and YTD for a specific month. The month selection is also adjustable, and by changing the first month of the year in range E1, the data for that month is automatically updated.
Click to buy Architecture KPI Dashboard in Google Sheets
4. Target Sheet Tab
This sheet is where you will input target numbers for each KPI. The data is entered both for MTD and YTD to enable comparisons with actual performance.
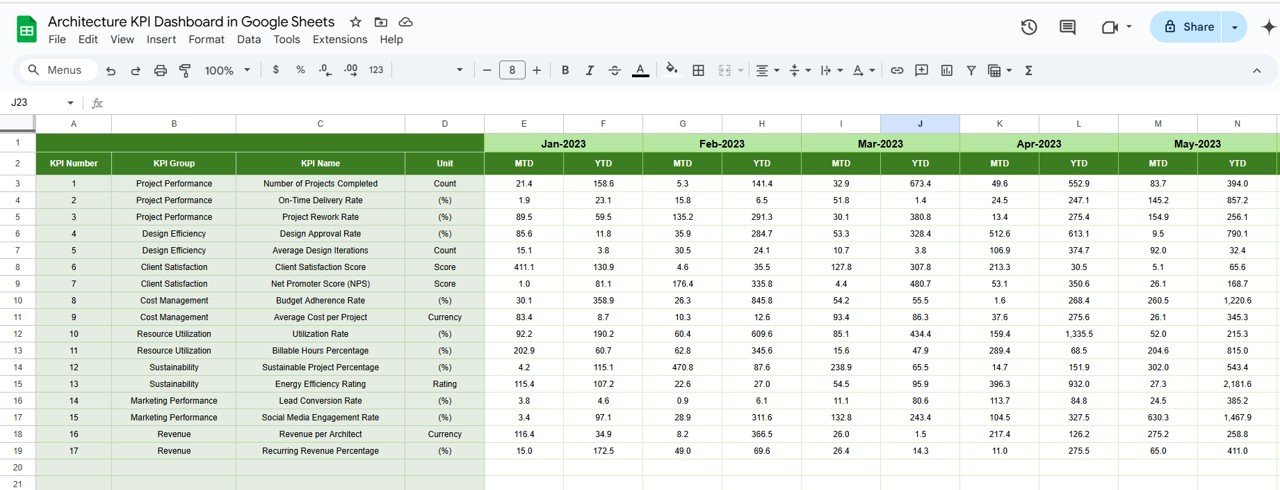
5. Previous Year Numbers Sheet Tab
Here, you will input data for the previous year. This allows for year-over-year comparisons, which helps in evaluating how performance has improved or declined over time.
Click to buy Architecture KPI Dashboard in Google Sheets
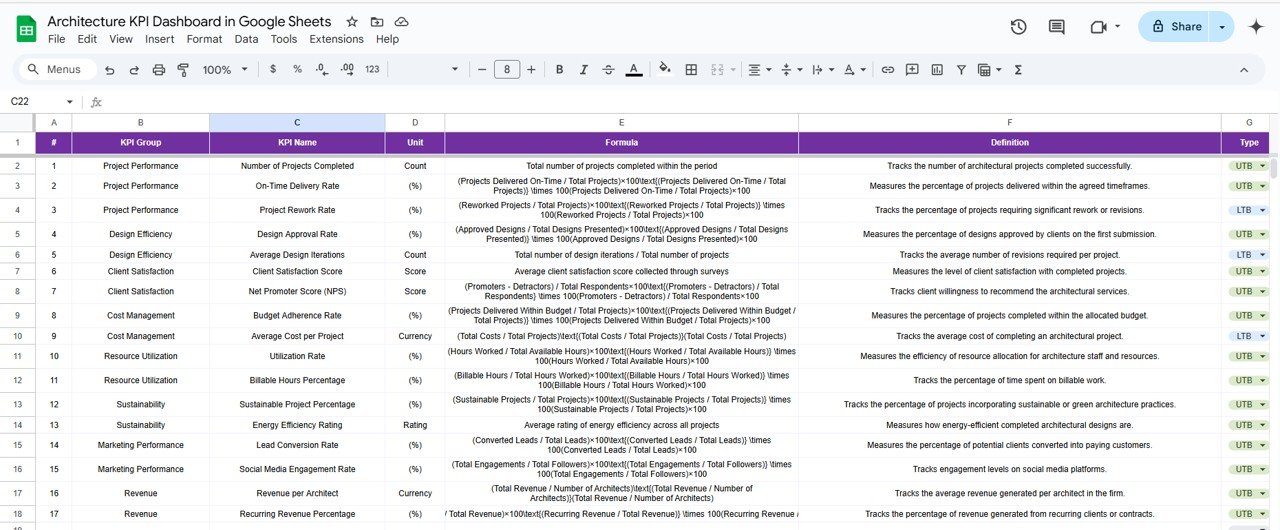
6. KPI Definition Sheet Tab
This sheet lists each KPI’s name, group, unit, formula, and definition, making it easier for users to understand how each metric is calculated and interpreted.
Advantages of the Architecture KPI Dashboard in Google Sheets
- Real-Time Data Tracking: By using this dashboard, you can track data in real-time. Updates to data are automatically reflected across the entire dashboard, helping you stay informed about project performance at any moment.
- Customizable and Flexible: The dashboard is fully customizable, allowing you to adjust it according to the unique needs of your architecture projects. Whether you are tracking costs, timelines, or client satisfaction, this tool adapts to your requirements.
- Comprehensive Overview; The dashboard provides a detailed view of both MTD and YTD metrics, which helps in understanding project performance over time and ensures that you can make informed decisions.
- Easy-to-Use Interface: With dropdown menus for KPI selection and month adjustments, the interface is intuitive and simple, ensuring ease of use even for those with minimal technical expertise.
- Cost-Effective Solution; Since the dashboard is built in Google Sheets, it doesn’t require any third-party software or additional licenses. It’s a cost-effective solution for small to large architecture firms.
- Collaborative Tool: As the dashboard is hosted on Google Sheets, it can be shared and edited by multiple team members in real-time, making collaboration seamless, especially for teams working remotely or across different locations.
Opportunities for Improvement in the Architecture KPI Dashboard
Click to buy Architecture KPI Dashboard in Google Sheets
Integration with Other Tools
Currently, the dashboard does not integrate with other tools, such as project management or accounting software. Adding integrations could help automate data transfer and streamline workflows.
- Data Entry Automation: Automating data entry using Google Apps Script or external APIs would reduce manual effort and ensure more accurate and up-to-date data in real-time.
- Advanced Visualizations; While the dashboard provides basic visualizations, incorporating advanced charts such as heatmaps or trend graphs could offer more in-depth insights into KPI performance.
- Additional KPIs; Expanding the dashboard to track more KPIs related to client satisfaction, resource utilization, or sustainability could help architects gain a fuller picture of their project performance.
- Mobile Optimization; The dashboard works well on desktop, but optimizing it for mobile use would improve accessibility for users who need to access the data while on-site or on the go.
- User Access Controls; Adding more granular access controls, such as limiting edit rights or defining user roles (e.g., view-only or full access), would enhance data security and ensure appropriate access levels.
Best Practices for Using the Architecture KPI Dashboard in Google Sheets
Click to buy Architecture KPI Dashboard in Google Sheets
- Regularly Update the Data: To ensure that the dashboard remains accurate and relevant, update it regularly. Ideally, data should be updated monthly to track project progress and make adjustments if necessary.
- Set Clear Data Entry Guidelines; Provide clear guidelines on how data should be entered to avoid inconsistencies. For instance, set up dropdown menus for predefined categories and use data validation rules to restrict input errors.
- Utilize Conditional Formatting: Leverage conditional formatting to highlight areas that need attention. Color-coded arrows or bars can quickly show whether a KPI is above or below target.
- Maintain Consistency in KPI Definitions: Ensure that all KPIs are defined consistently across projects. This will help maintain accuracy when comparing results and drawing conclusions from the data.
- Customize KPIs to Your Specific Needs: Customize the KPIs to reflect the unique goals and priorities of your architecture firm. Modify the formulas or definitions to align with your project objectives and business needs.
- Review the Dashboard Frequently; Make it a habit to review the dashboard regularly with your team. Use the dashboard as a tool to assess progress, identify trends, and decide on corrective actions if necessary.
- Solicit Feedback from Team Members: Get feedback from your team on the dashboard’s functionality and usability. Understanding how they use the tool and what additional features they need will help you improve its design and effectiveness.
Conclusion
The Architecture KPI Dashboard in Google Sheets is an essential tool for architects and project managers looking to optimize their project performance. With its user-friendly interface, customizable features, and real-time data tracking, this dashboard can help you track key project metrics, make informed decisions, and ensure that your projects stay on budget and on time.
By following best practices, leveraging its advantages, and addressing potential improvements, you can maximize the value of this powerful tool in your architecture projects.
Frequently Asked Questions (FAQs)
Click to buy Architecture KPI Dashboard in Google Sheets
1. How can I update the Architecture KPI Dashboard?
You can update the dashboard by entering the actual data for MTD and YTD in the designated sheets. The dashboard will automatically reflect the updated data.
2. Can I track multiple architecture projects using this dashboard?
Yes, the dashboard is customizable, so you can adapt it to track multiple projects by creating separate sections or sheets for each project.
3. Can I collaborate with my team on the dashboard?
Yes, since the dashboard is in Google Sheets, you can share it with your team and collaborate in real-time. You can also set different permissions for editing or viewing.
4. Is it possible to integrate this dashboard with other project management tools?
While the dashboard does not currently have built-in integrations, you can use Google Apps Script or third-party tools to automate data syncing between different platforms.
5. How can I ensure the data entered is accurate?
Set clear data entry guidelines and use validation rules to minimize errors. You can also use dropdown menus for predefined categories to avoid input mistakes.
Visit our YouTube channel to learn step-by-step video tutorials
Youtube.com/@NeotechNavigators
Watch the step-by-step video Demo: