In today’s digital age, organizing and tracking virtual events has become an integral part of many organizations’ operations. Whether it’s a webinar, an online conference, or a virtual networking event, having a reliable system to measure key performance indicators (KPIs) is essential to ensure success. The Virtual Events KPI Dashboard in Google Sheets is a powerful and easy-to-use tool designed to help you monitor the effectiveness of your virtual events by tracking crucial metrics.
This article will dive deep into the Virtual Events KPI Dashboard, highlighting its key features, the essential KPIs you can track, and best practices for using the dashboard to improve your event outcomes.
What is a Virtual Events KPI Dashboard in Google Sheets?
A Virtual Events KPI Dashboard in Google Sheets is a comprehensive, interactive tool designed to track and visualize the performance of virtual events. Built within Google Sheets, this dashboard allows users to enter, manage, and analyze data related to their virtual events, all in one place. By providing a snapshot of key metrics, this dashboard enables event planners, organizers, and marketers to assess their virtual events’ success and areas of improvement.
Key Features of the Virtual Events KPI Dashboard in Google Sheets
This dashboard comes with six distinct worksheets, each designed to handle specific data points and make the tracking process as seamless as possible:
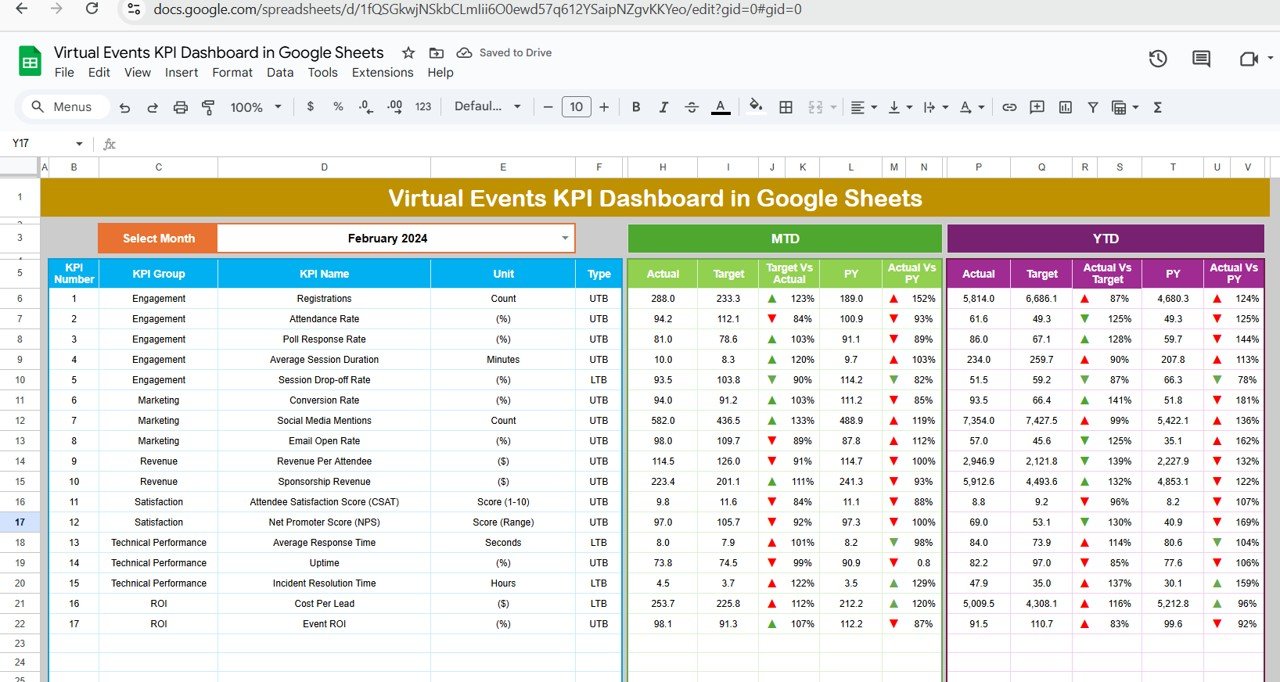
Dashboard Sheet Tab
This is the central hub of your dashboard, where you can get an overview of all your KPIs.
Month Selection: You can select the month of interest from the dropdown menu in D3, and the entire dashboard will update with the selected month’s data.
Metrics Displayed:
- MTD (Month-to-Date) Actual: Displays the actual performance for the selected month.
- MTD Target: Shows the target set for the month.
- PY (Previous Year) vs Actual: Compares the actual performance of the current month with the same period from the previous year.
- YTD (Year-to-Date) Actual: Displays cumulative actual performance from the beginning of the year.
- YTD Target vs Actual: Shows how well the performance is tracking against the YTD target.
- Conditional Formatting: Uses arrows to indicate whether the performance is up or down compared to the target and previous year.
Click to buy Virtual Events KPI Dashboard in Google Sheets
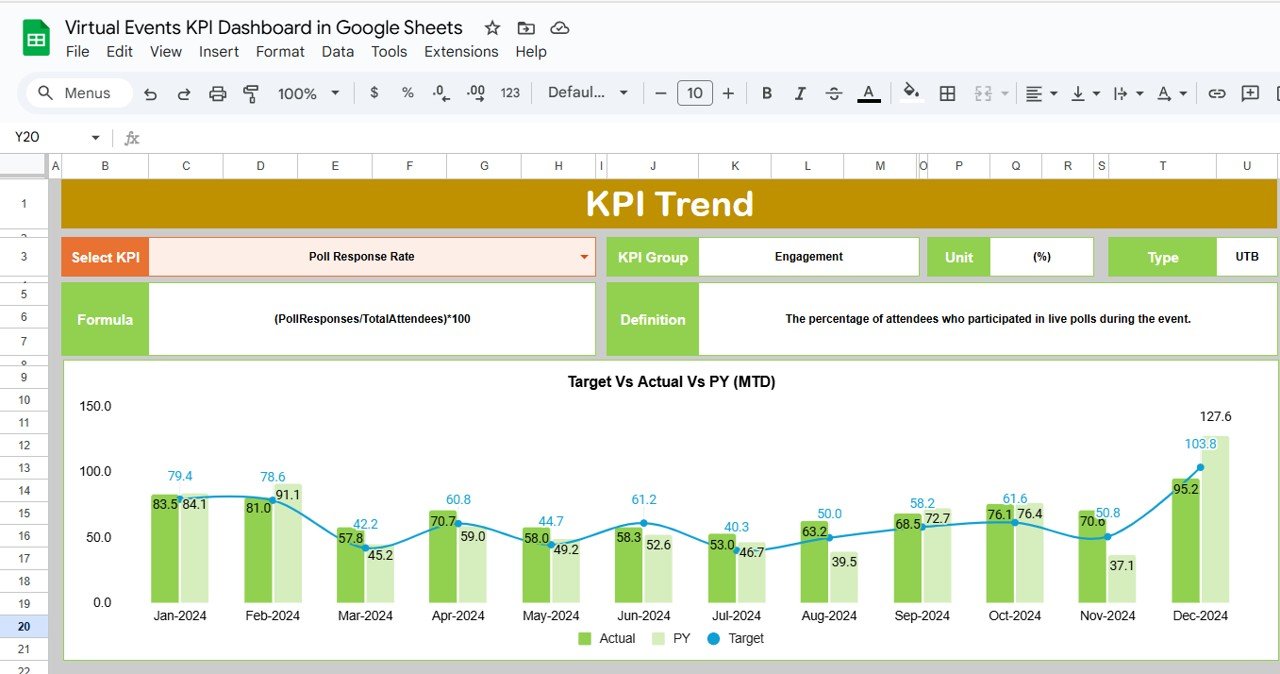
KPI Trend Sheet Tab
This sheet allows you to track the trend of each KPI over time.
- KPI Selection: Choose a KPI from the dropdown menu in C3.
- KPI Details: Displays the KPI group, unit, formula, and whether it is “Lower the Better” or “Upper the Better.”
Click to buy Virtual Events KPI Dashboard in Google Sheets
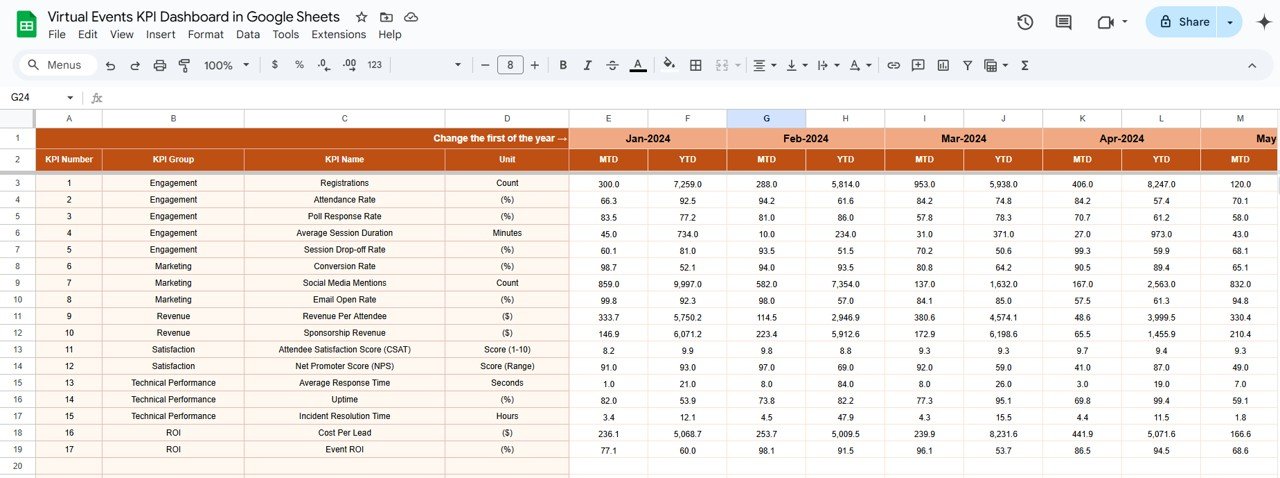
Actual Number Sheet Tab
- Input Data: Here, you input the actual performance data for each KPI for the current year.
- Monthly Input: The month can be selected in E1, and you enter the actual numbers for that month.
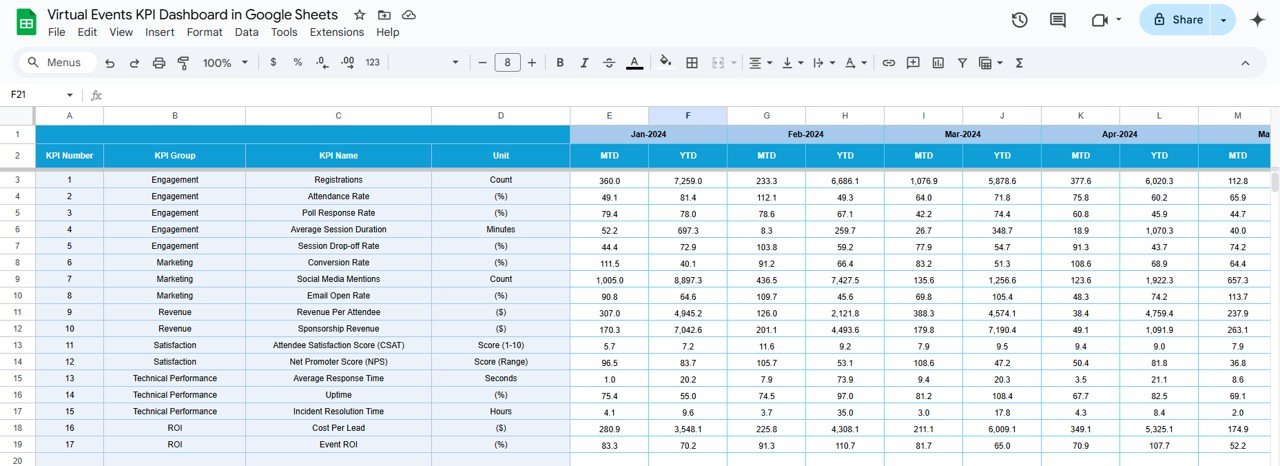
Target Sheet Tab
- Target Data: Enter the target values for each KPI for both MTD and YTD in this sheet.
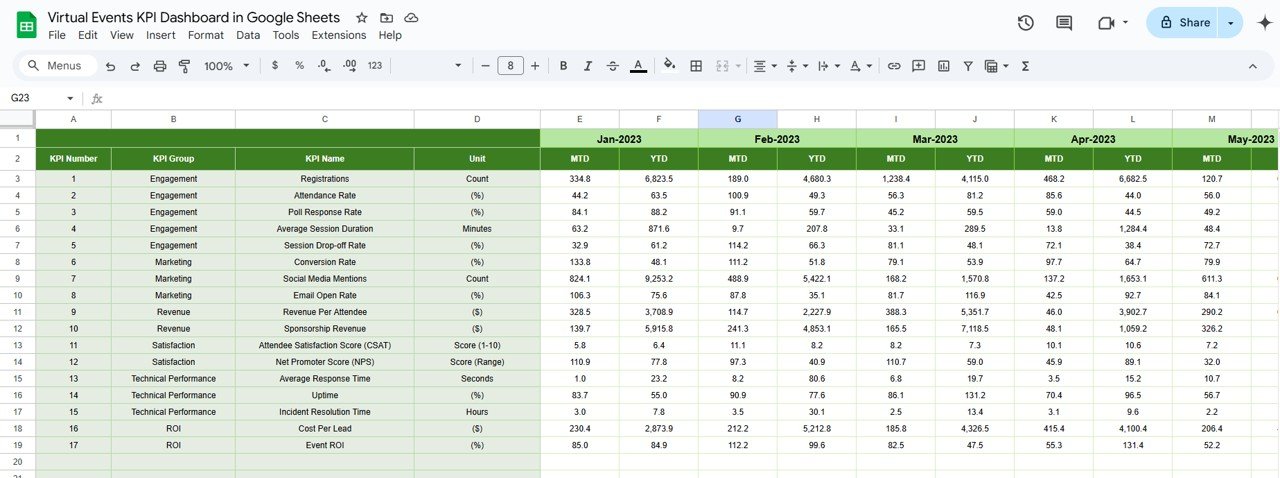
Previous Year Number Sheet Tab
Click to buy Virtual Events KPI Dashboard in Google Sheets
- Historical Data: This sheet is where you enter the performance numbers from the previous year to compare against the current year’s data.
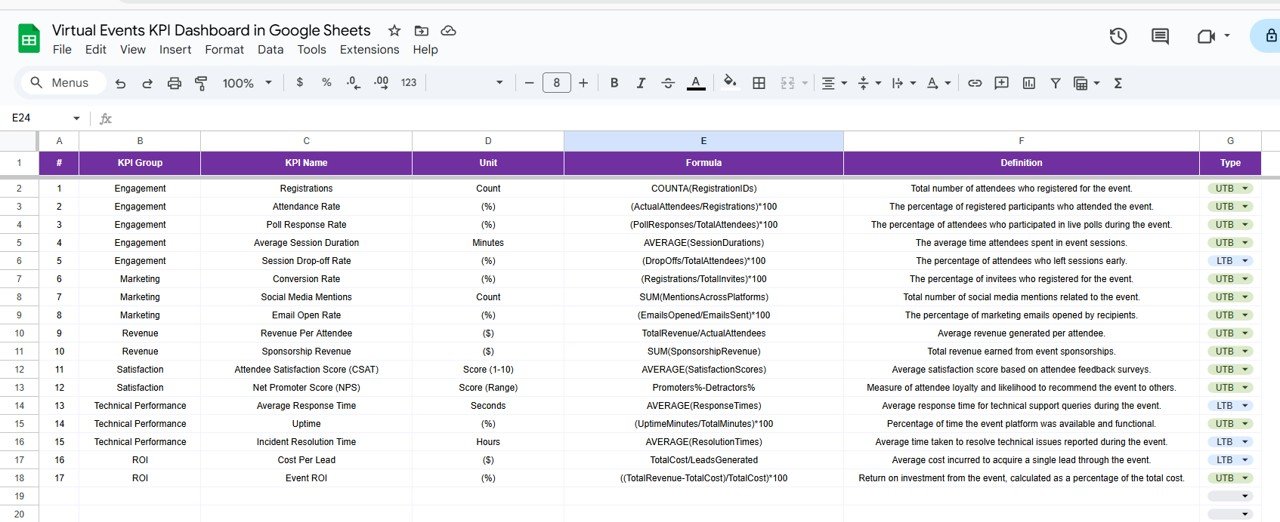
KPI Definition Sheet Tab
- Detailed Definitions: In this sheet, you define the KPI name, group, unit, formula, and detailed definitions for each metric.
Click to buy Virtual Events KPI Dashboard in Google Sheets
Advantages of Using the Virtual Events KPI Dashboard
The Virtual Events KPI Dashboard in Google Sheets offers several advantages, making it an essential tool for any event organizer:
-
Centralized Tracking: All essential KPIs are in one place, making it easy to track and analyze event performance in real time.
-
Customizable: Easily customize the dashboard to track KPIs specific to your events. Whether you’re organizing webinars or virtual conferences, this dashboard can be tailored to your needs.
-
Data-Driven Insights: The dashboard provides valuable insights into how well your events are performing, helping you identify areas for improvement.
-
Real-Time Data Updates: Once you input new data, the dashboard automatically updates to reflect the most current performance metrics.
-
Collaborative Tool: Built in Google Sheets, the dashboard is easy to share, allowing multiple team members to collaborate and stay on the same page.
Opportunity to Improve in Virtual Events KPIs
While the Virtual Events KPI Dashboard is a powerful tool, there are several opportunities for improvement:
-
Advanced Analytics: Integrating more complex analytics, such as predictive modeling or trend analysis, can help forecast event outcomes and improve planning.
-
Automation: Automating data entry by linking the dashboard with other event management tools could save time and reduce errors.
-
More Visualizations: Adding charts and graphs could make it easier for stakeholders to quickly interpret data.
-
Incorporating Attendee Feedback: Directly integrating attendee feedback into the dashboard would provide immediate insights into attendee satisfaction.
Best Practices for Using the Virtual Events KPI Dashboard
Click to buy Virtual Events KPI Dashboard in Google Sheets
To maximize the effectiveness of the Virtual Events KPI Dashboard, follow these best practices:
-
Set Clear Goals and Targets: Before tracking any KPIs, set specific, measurable, and achievable targets for your virtual events.
-
Regularly Update Data: Ensure data is entered regularly for accurate, up-to-date performance tracking.
-
Leverage Data Insights: Use the data provided by the dashboard to refine your event strategies, improve future events, and achieve better results.
-
Review and Analyze Trends: Monitor trends over time to identify areas where you can improve engagement, attendance, or overall satisfaction.
-
Collaborate with Your Team: Share the dashboard with team members to ensure everyone is aligned and working towards the same goals.
Frequently Asked Questions (FAQs)
1. How do I update the Virtual Events KPI Dashboard?
Simply input your new data for MTD and YTD into the Actual Number Sheet and Target Sheet, and the dashboard will automatically update.
2. Can I add custom KPIs to the dashboard?
Yes, the dashboard is customizable, allowing you to add or modify KPIs to fit the specific needs of your virtual event.
3. Can I use this dashboard for in-person events?
While this dashboard is designed for virtual events, it can be adapted for in-person events by modifying the KPIs and metrics.
4. How can I track attendee satisfaction using the dashboard?
Attendee satisfaction can be tracked through feedback ratings, which can be inputted into the KPI Trend Sheet. The dashboard will then display the average satisfaction score.
5. Is the Virtual Events KPI Dashboard accessible from multiple devices?
Yes, since the dashboard is built in Google Sheets, it is cloud-based and accessible from any device with an internet connection.
Conclusion
Click to buy Virtual Events KPI Dashboard in Google Sheets
The Virtual Events KPI Dashboard in Google Sheets is a valuable tool for tracking and improving the performance of your virtual events. By tracking critical KPIs such as engagement rates, attendance, and feedback ratings, event organizers can make data-driven decisions to optimize their virtual events. This ready-to-use template offers a centralized and customizable solution that makes event performance monitoring easier than ever.
Visit our YouTube channel to learn step-by-step video tutorials
Youtube.com/@NeotechNavigators
Watch the step-by-step video Demo: