The gig economy is rapidly transforming how businesses and individuals operate, with workers offering their services on-demand for short-term tasks. Managing performance in such a dynamic environment requires constant tracking of key performance indicators (KPIs). The Gig Economy KPI Dashboard in Google Sheets is a ready-to-use tool that helps gig economy businesses monitor critical metrics like worker engagement, task completion rates, earnings, and more.
In this article, we’ll explore the Gig Economy KPI Dashboard in Google Sheets, its key features, and how it can help you optimize your gig economy operations by tracking essential KPIs in real-time.
What is the Gig Economy KPI Dashboard in Google Sheets?
The Gig Economy KPI Dashboard in Google Sheets is a data-driven template designed to help businesses and gig workers track key performance indicators (KPIs) related to gig economy tasks. It allows you to measure and analyze performance, identify areas for improvement, and make data-driven decisions to optimize operations.
This dashboard contains six main worksheets, each designed to focus on different aspects of gig economy performance, from task completion and worker productivity to earnings and customer satisfaction.
Key Features of the Gig Economy KPI Dashboard in Google Sheets
The dashboard consists of six worksheets, each targeting specific aspects of gig economy performance:
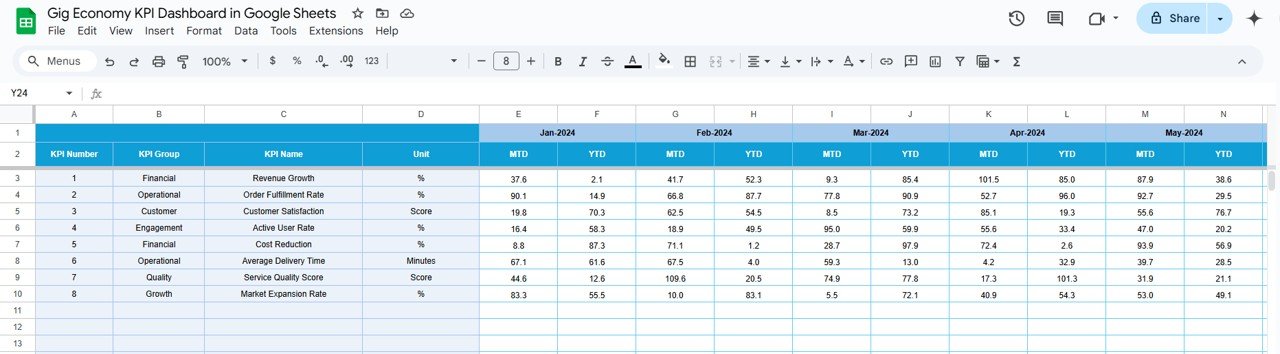
1. Dashboard Sheet Tab
The Dashboard Sheet is the main page of the template, providing a high-level view of all KPIs. Key features include:
MTD (Month-to-Date) and YTD (Year-to-Date) Metrics:
- MTD Actual: Displays the actual data for the current month.
- MTD Target: Shows the target data for the current month.
- PY vs Actual: Compares the current month’s performance with the same period from the previous year (PY).
- YTD Actual: Cumulative actual data for the year.
- YTD Target vs Actual: Comparison of the YTD target with actual performance for the year.
- Conditional Formatting: Visual indicators (e.g., up/down arrows) indicate whether performance is above or below the target and PY data.

Click to buy Gig Economy KPI Dashboard in Google Sheets
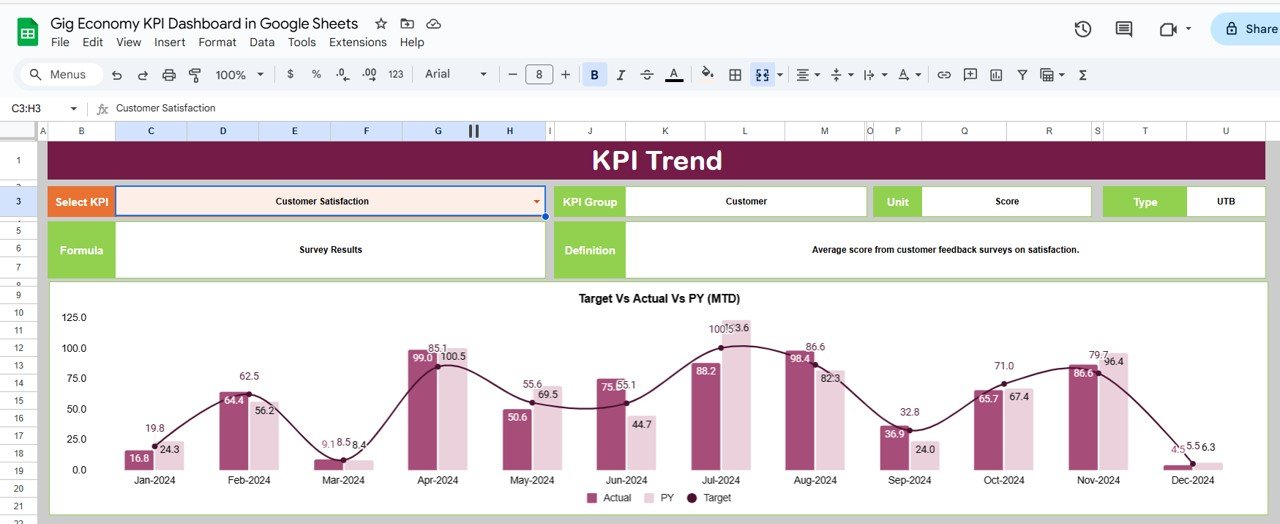
2. KPI Trend Sheet Tab
The KPI Trend Sheet allows you to track individual KPIs over time, providing insights into trends and performance changes:
KPI Selection Dropdown:
Select a KPI from the dropdown in C3, and the sheet will display:
- KPI Group: The category of the KPI (e.g., worker engagement, earnings, task completion).
- Unit of KPI: The unit of measurement for the KPI (e.g., dollars, percentage, number of tasks).
- Type of KPI: Whether the KPI is “Lower the Better” or “Upper the Better.”
- Formula of KPI: The formula used to calculate each KPI.
- KPI Definition: A description of what each KPI measures and its relevance to gig economy performance.
3. Actual Number Sheet Tab
The Actual Number Sheet is where you enter the actual data for MTD and YTD. This data is automatically reflected in the dashboard.
-
Monthly Data Entry:
Input the actual data for each KPI for the selected month (indicated in E1), and the dashboard will update to reflect the changes.

Click to buy Gig Economy KPI Dashboard in Google Sheets
4. Target Sheet Tab
The Target Sheet allows you to enter the target values for each KPI for both MTD and YTD. These targets are used to assess how well your gig economy operations are performing.
-
Target Data Entry:
Enter the target values for each KPI, and the dashboard will compare actual performance against these targets.
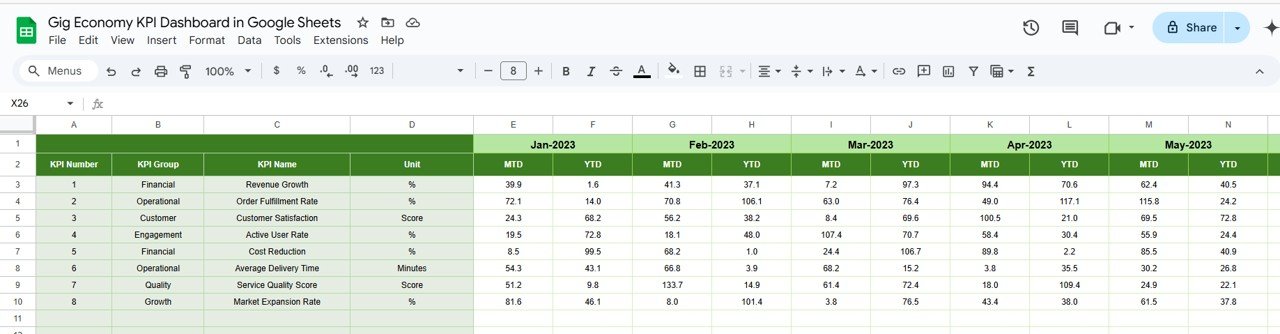
5. Previous Year Number Sheet Tab
The Previous Year Number Sheet stores the data from the previous year, allowing you to compare current performance with historical data.
-
Previous Year Data Entry:
Enter last year’s data for each KPI to track progress and assess the growth of your gig economy operations.
Click to buy Gig Economy KPI Dashboard in Google Sheets
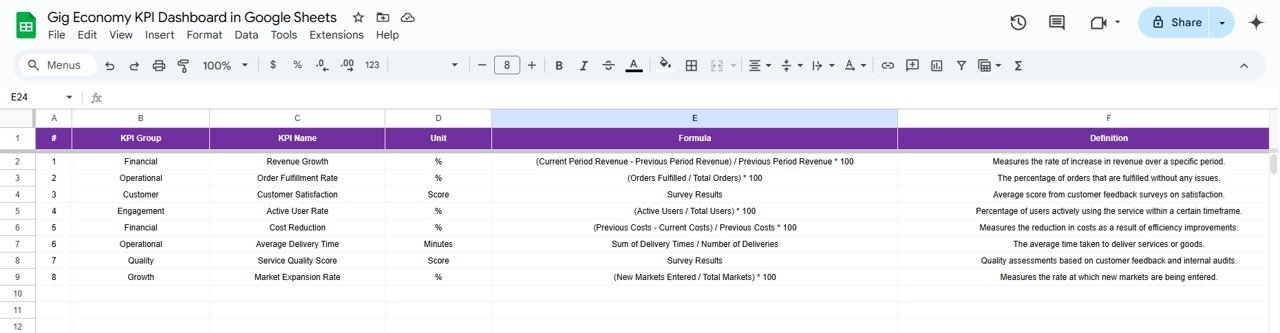
6. KPI Definition Sheet Tab
The KPI Definition Sheet provides clear definitions for each KPI, ensuring that everyone involved understands what each metric tracks.
-
KPI Definitions:
Each KPI is defined by its name, group, unit, formula, and explanation of what it measures and how it contributes to performance analysis.
Advantages of Using the Gig Economy KPI Dashboard
-
Real-Time Performance Monitoring: The dashboard provides real-time insights into your gig economy operations, allowing you to make timely decisions based on up-to-date data.
-
Customizable for Your Needs: The template is customizable, enabling you to track the KPIs most relevant to your business and adjust the dashboard to fit your specific needs.
-
Visual Data Representation: With charts, graphs, and conditional formatting, the dashboard offers clear visual feedback, helping you easily identify areas for improvement or success.
-
Comprehensive Tracking: Track all important gig economy metrics in one place, from task completion and worker engagement to client satisfaction and earnings.
-
Data-Driven Decision Making: The dashboard helps you optimize operations and improve performance by providing detailed, data-driven insights into key KPIs.
Best Practices for Using the Gig Economy KPI Dashboard
-
Update Data Regularly: Make sure to enter new data frequently to keep the dashboard accurate and reflective of current performance.
-
Monitor Key KPIs: Focus on the KPIs that directly impact your gig economy business, such as Total Earnings, Task Completion Rate, and Client Satisfaction Score.
-
Analyze Year-over-Year Trends: Use the Previous Year Number Sheet to compare this year’s data with last year’s performance, helping you identify growth patterns and areas for improvement.
-
Leverage Insights for Strategy Improvement: Use the insights gained from the dashboard to refine your gig economy strategy, optimize task management, and improve worker engagement.
Frequently Asked Questions (FAQs)
Click to buy Gig Economy KPI Dashboard in Google Sheets
1. How do I update the Gig Economy KPI Dashboard?
Simply enter the latest data in the Actual Number Sheet, and the dashboard will automatically update with the new performance metrics.
2. Can I track multiple gig economy platforms with this dashboard?
Yes, the dashboard is fully customizable. You can adjust the template to track performance across multiple gig platforms by adding new columns or sections.
3. How do I compare my current performance with previous years?
Enter the data from the previous year in the Previous Year Number Sheet to make year-over-year comparisons and assess your business growth.
Conclusion
The Gig Economy KPI Dashboard in Google Sheets is a valuable tool for tracking and optimizing your gig economy business. With real-time insights into key performance metrics such as earnings, task completion rates, and client satisfaction, the dashboard helps you make data-driven decisions that drive success. Whether you’re managing a small gig platform or a large gig economy operation, this dashboard is essential for monitoring performance and achieving growth.
Visit our YouTube channel to learn step-by-step video tutorials
Youtube.com/@NeotechNavigators
Watch the step-by-step video Demo: