Managing organizational events efficiently requires proper planning, tracking, and post-event analysis. The Organizational Event Planning & Analysis Dashboard in Google Sheets provides a ready-to-use solution for planners, coordinators, and event managers to monitor all aspects of their events — from attendee numbers to costs and feedback — in one centralized dashboard.Organizational Event Planning & Analysis Dashboard in Google Sheets
This interactive Google Sheets tool helps simplify event management by providing visual insights through dynamic charts, key performance cards, and built-in search capabilities.Organizational Event Planning & Analysis Dashboard in Google Sheets
What Is an Organizational Event Planning & Analysis Dashboard in Google Sheets?
An Organizational Event Planning & Analysis Dashboard is a smart, visual management tool that consolidates event data such as attendance, cost, venue usage, and feedback into one interactive workspace. Built in Google Sheets, this dashboard makes it easy for organizations to:
-
Plan events and track performance over time
-
Compare expected vs. actual results
-
Monitor planner and venue performance
-
Analyze attendee engagement and satisfaction
-
Optimize budgets and resources for future events
Key Features of the Dashboard
Click to Buy Organizational Event Planning & Analysis Dashboard in Google Sheets
This ready-to-use dashboard comes with multiple interconnected sheets, making it both functional and visually intuitive.
1. Overview Sheet Tab
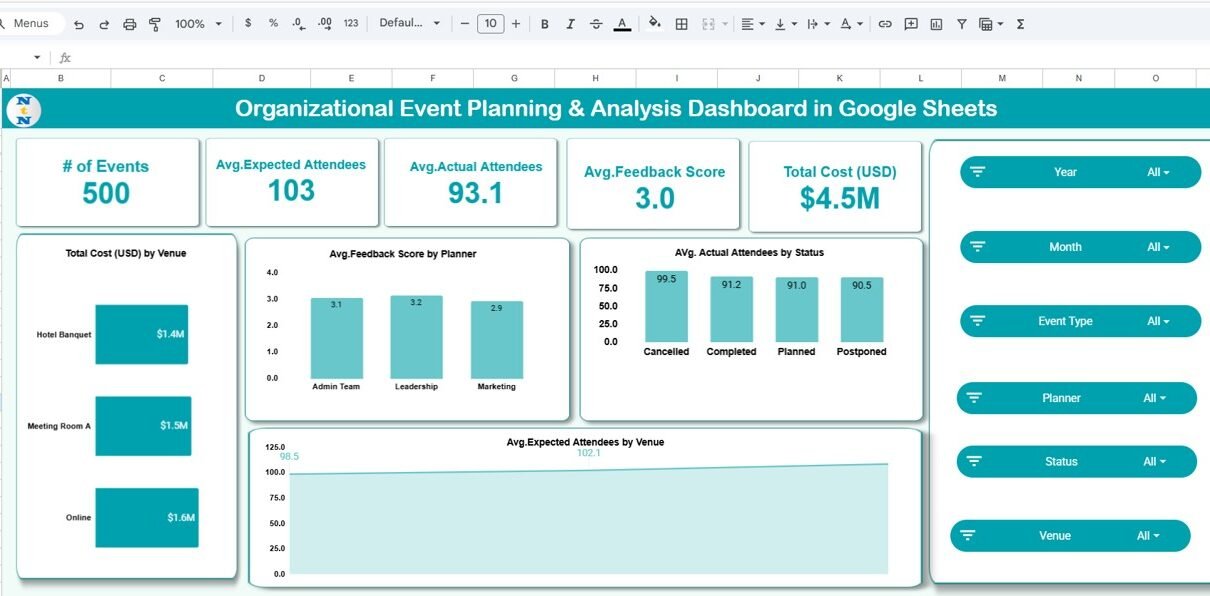
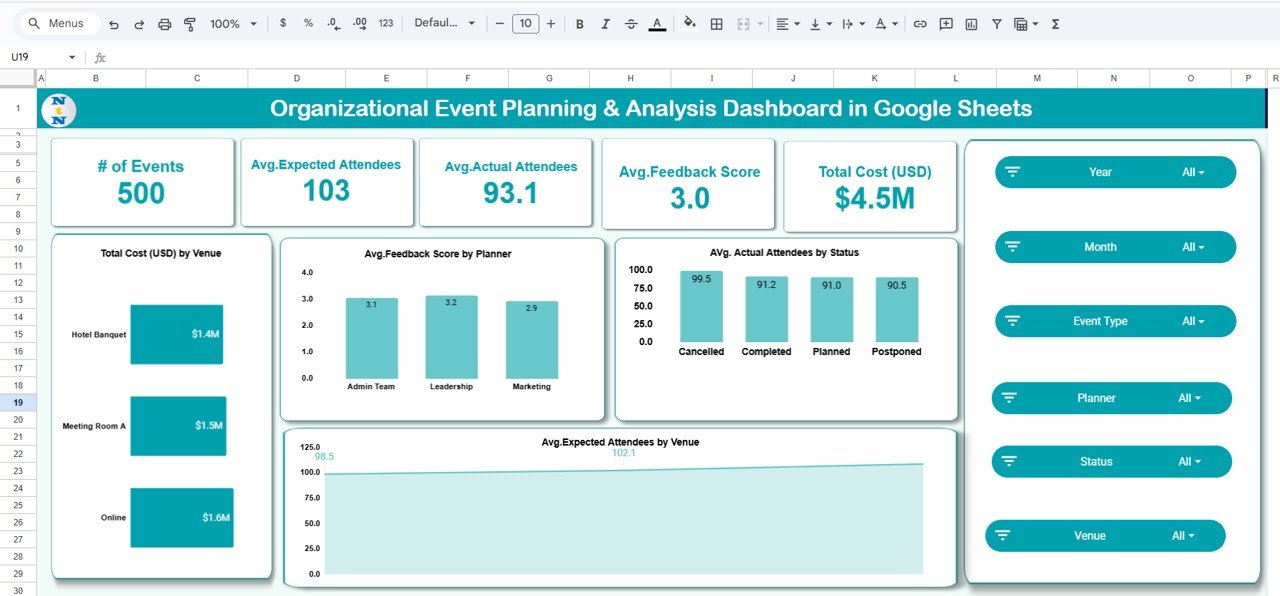
The main page of the dashboard presents summarized insights and visuals at a glance.
Cards Display
-
# of Events: Total number of events conducted
-
Avg. Expected Attendees: Average expected participation across all events
-
Avg. Actual Attendees: Average real attendance count
-
Avg. Feedback Score: Mean satisfaction rating (usually on a 1–5 scale)
-
Total Cost (USD): Total expenditure across all events
Charts Included
-
Total Cost (USD) by Venue: Identifies which venues consume the most budget
-
Avg. Feedback Score by Planner: Compares planners based on attendee satisfaction
-
Avg. Actual Attendees by Status: Tracks participation levels across completed, ongoing, or canceled events
-
Avg. Expected Attendees by Venue: Evaluates turnout potential for each location
Click to Buy Organizational Event Planning & Analysis Dashboard in Google Sheets
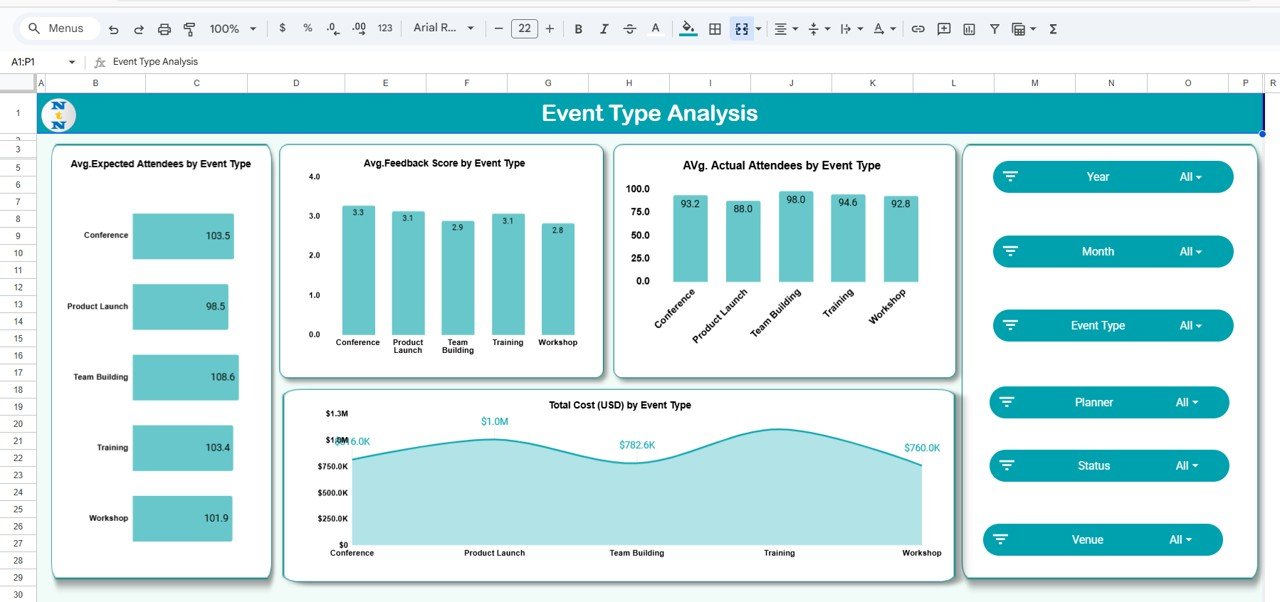
2. Event Type Analysis
This section focuses on analyzing performance by event category.
Charts:
-
Avg. Expected Attendees by Event Type – Helps assess interest level by event type (e.g., conferences, workshops, training sessions)
-
Avg. Feedback Score by Event Type – Measures participant satisfaction
-
Avg. Actual Attendees by Event Type – Tracks how actual turnout compares with projections
-
Total Cost (USD) by Event Type – Monitors spending efficiency per category
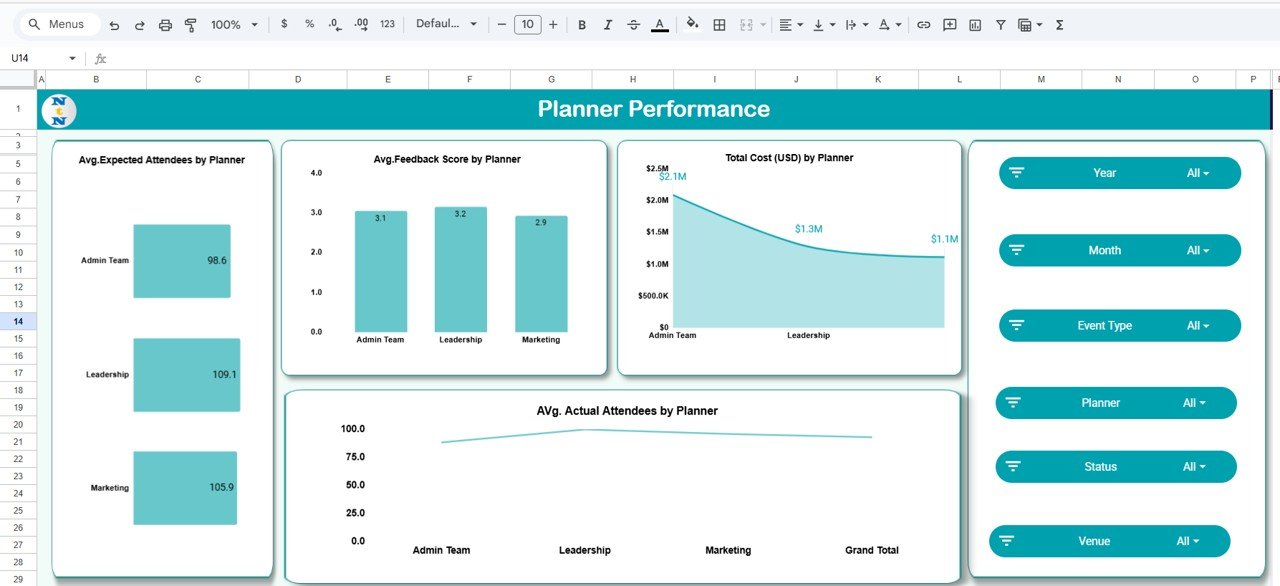
3. Planner Performance
Evaluating planner performance ensures accountability and efficiency.
Charts:
-
Avg. Expected Attendees by Planner – Determines planners’ audience reach
-
Avg. Feedback Score by Planner – Highlights planners achieving the best ratings
-
Total Cost (USD) by Planner – Tracks spending efficiency by planner
-
Avg. Actual Attendees by Planner – Compares turnout against planned figures
Click to Buy Organizational Event Planning & Analysis Dashboard in Google Sheets
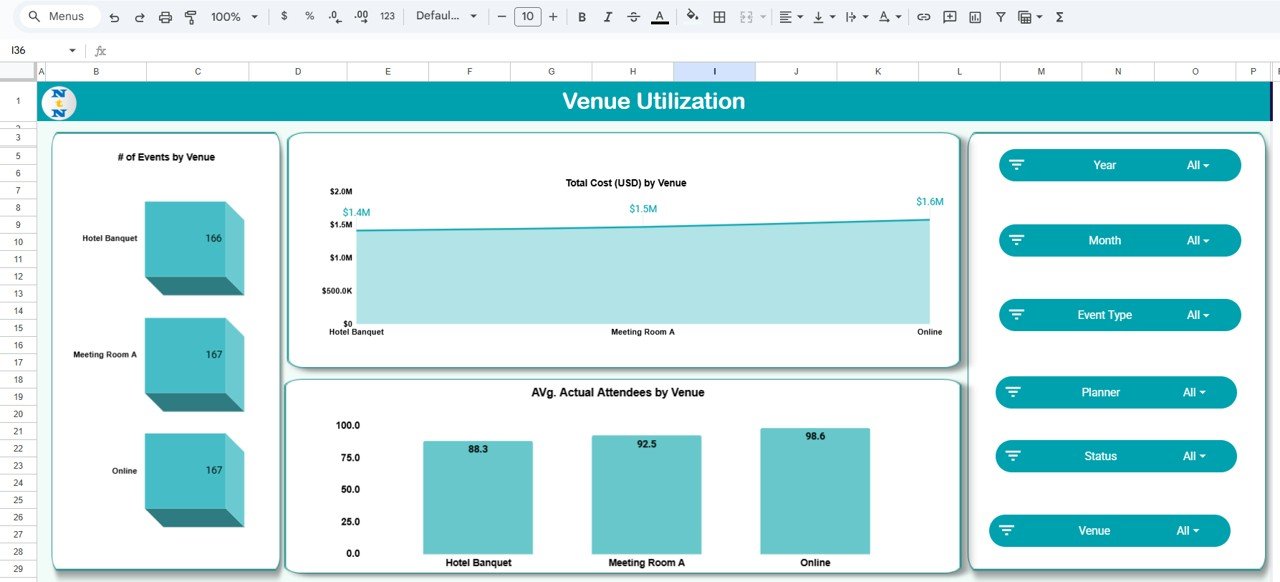
4. Venue Utilization
This page analyzes how effectively different venues are being used.
Charts:
-
# of Events by Venue – Tracks event frequency by location
-
Total Cost (USD) by Venue – Shows spending allocation per venue
-
Avg. Actual Attendees by Venue – Identifies venues with higher engagement
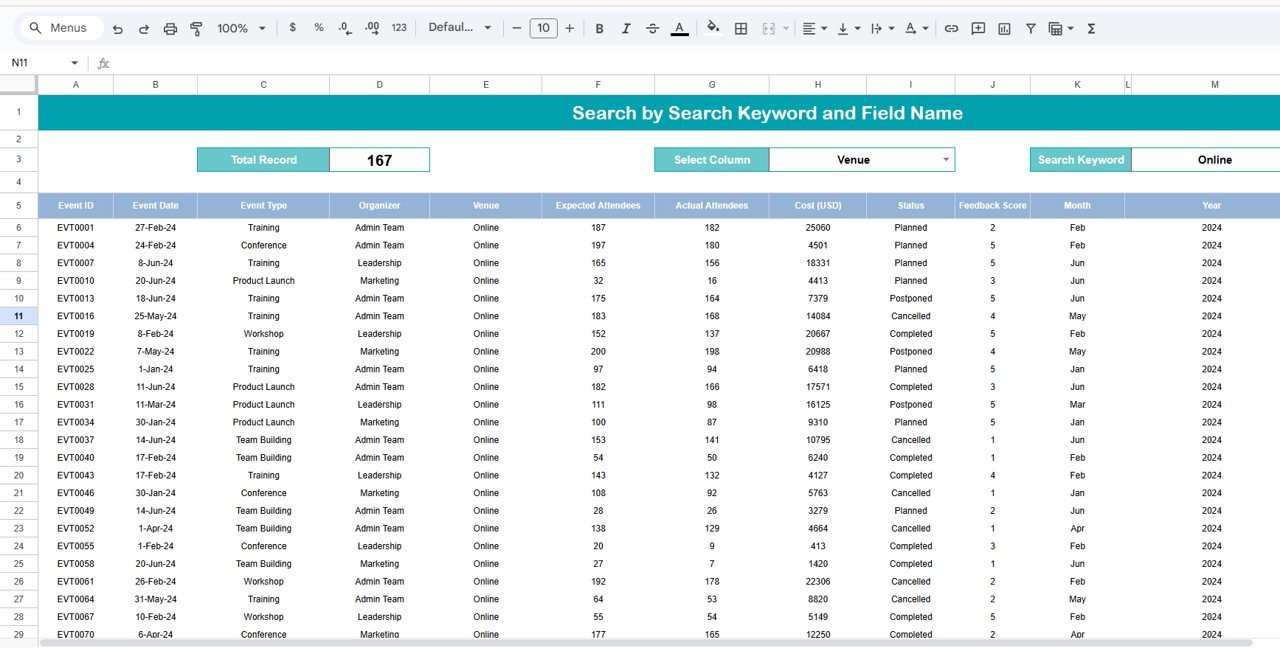
5. Search Functionality
The Search feature allows users to filter event data easily.
You can search by keyword and field name — for example, by planner, event type, or location — to instantly find specific records or patterns.
Click to Buy Organizational Event Planning & Analysis Dashboard in Google Sheets
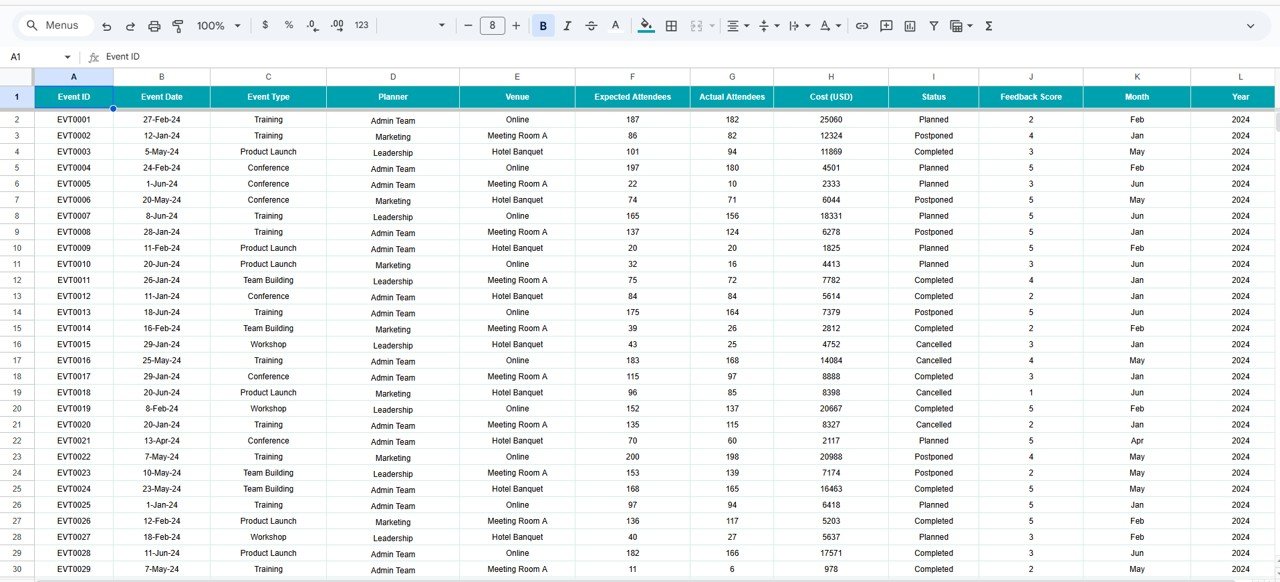
6. Data Sheet Tab
This sheet is the core data source for the dashboard.
It stores all event details including:
-
Event Name
-
Date and Venue
-
Expected and Actual Attendees
-
Status (Planned, Ongoing, Completed, or Canceled)
-
Planner Name
-
Cost
-
Feedback Score
All visualizations and metrics in the dashboard are powered dynamically by this data sheet.
Advantages of Using the Organizational Event Planning & Analysis Dashboard in Google Sheets
-
Centralized Tracking: Manage multiple events from a single spreadsheet
-
Visual Insights: Identify performance trends with interactive charts
-
Improved Budget Management: Track costs by venue, planner, and event type
-
Enhanced Accountability: Compare planner performance and audience satisfaction
-
Data-Driven Decisions: Optimize resources using historical event data
-
User-Friendly Design: No coding or add-ons required — works entirely in Google Sheets
Best Practices for Using the Dashboard
Click to Buy Organizational Event Planning & Analysis Dashboard in Google Sheets
-
Keep Data Updated: Enter event details promptly to maintain real-time accuracy
-
Standardize Feedback Scales: Use consistent scoring (e.g., 1–5 or 1–10) for comparability
-
Segment by Event Type: Analyze performance differences across conferences, meetings, and training programs
-
Review Planner Metrics: Identify top-performing planners based on feedback and turnout
-
Use Venue Analysis: Track which locations deliver the best cost-to-engagement ratio
How This Dashboard Helps Organizational Event Planning & Analysis Dashboard in Google Sheets
-
Improves Event Planning: Identify high-performing event formats and venues
-
Enhances Participant Experience: Use feedback insights to improve future events
-
Saves Time and Cost: Eliminate manual reporting through automated charts
-
Supports Strategic Decisions: Provides data transparency for leadership teams
Frequently Asked Questions (FAQs)
Click to Buy Organizational Event Planning & Analysis Dashboard in Google Sheets
Q1: Can I add more event types or planners?
Yes. Simply add new rows in the Data sheet — the dashboard updates automatically.
Q2: How do I change the feedback scale?
You can modify the calculation in the Data sheet and adjust the chart references accordingly.
Q3: Can this dashboard handle multiple locations?
Yes, it’s designed for multi-location tracking across departments or regions.
Q4: Does the dashboard calculate averages automatically?
Yes. Metrics like average feedback, cost, and attendance update automatically based on your data.
Q5: Can I share the dashboard with my team?
Absolutely. Being in Google Sheets, it allows real-time sharing, viewing, and collaboration.Organizational Event Planning & Analysis Dashboard in Google Sheets
Conclusion
The Organizational Event Planning & Analysis Dashboard in Google Sheets is an essential tool for any organization that frequently hosts events. With its visual reporting, powerful analytics, and interactive filters, it helps teams evaluate event success, track planner performance, and optimize budgets effectively.Organizational Event Planning & Analysis Dashboard in Google Sheets
Visit our YouTube channel to learn step-by-step video tutorials
Youtube.com/@NeotechNavigators
Watch the step-by-step video Demo:
Click to Buy Organizational Event Planning & Analysis Dashboard in Google Sheets