Managing guest bookings, tracking revenue, and ensuring an excellent guest experience are at the heart of the hospitality industry. The Hospitality & Guest Booking Performance Dashboard in Google Sheets is a ready-to-use digital solution that brings all these performance metrics together in one place — helping hotel managers, resort owners, and guest service teams make data-driven decisions effortlessly.Hospitality & Guest Booking Performance Dashboard in Google Sheets
This article explains the structure, key metrics, charts, and benefits of using this interactive and easy-to-customize Google Sheets dashboard.Hospitality & Guest Booking Performance Dashboard in Google Sheets
What Is a Hospitality & Guest Booking Performance Dashboard in Google Sheets?
A Hospitality & Guest Booking Performance Dashboard is an analytical tool built in Google Sheets that allows hospitality professionals to monitor bookings, revenue, room performance, and customer satisfaction in real time.
It helps decision-makers visualize performance trends, compare results across room types or booking channels, and identify areas where improvements can enhance profitability and the overall guest experience.
This dashboard is perfect for hotels, homestays, resorts, and travel accommodation businesses aiming to centralize their data without expensive BI tools.
Structure of the Dashboard
The Hospitality & Guest Booking Performance Dashboard in Google Sheets includes several well-designed sheets:
Dashboard Sheet Tab
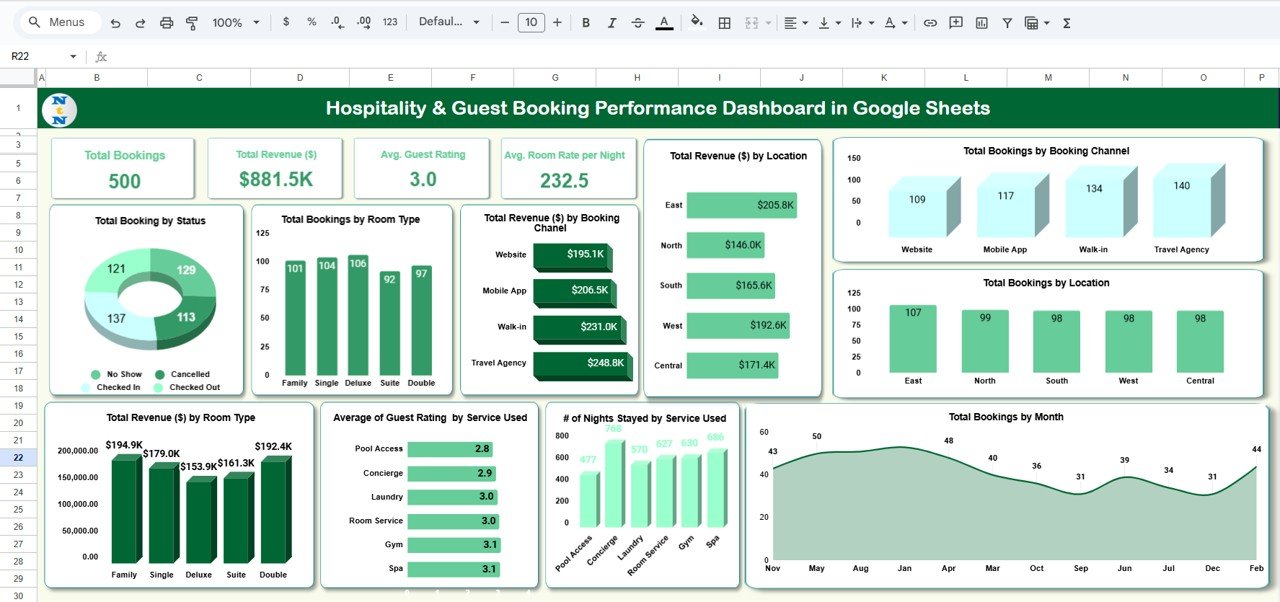
The Dashboard Sheet Tab serves as the visual control center for all booking and hospitality metrics. It combines dynamic charts and KPI cards for quick insights into performance.
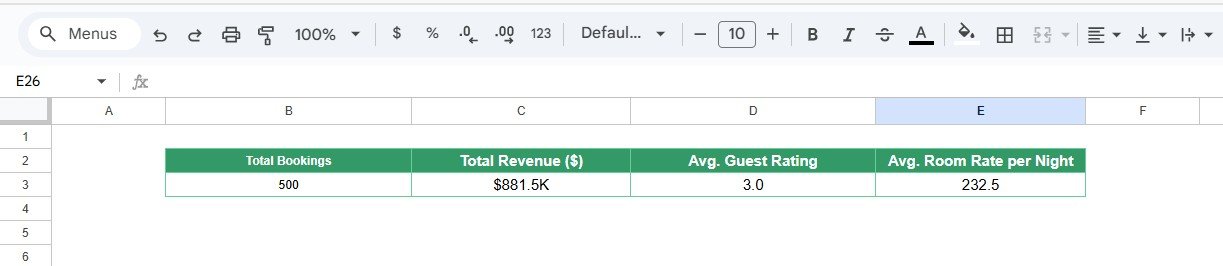
Cards Displayed:
-
Total Bookings → Total number of confirmed bookings.
-
Total Revenue ($) → Overall income generated from all bookings.
-
Avg. Guest Rating → Average customer satisfaction score based on guest feedback.
-
Avg. Room Rate per Night ($) → Average cost per night across all room types.
Charts Included:
-
Total Bookings by Status: Displays how many bookings are Confirmed, Checked In, Canceled, or Pending.
-
Total Bookings by Room Type: Shows which room categories (Deluxe, Family, Suite, etc.) are most popular.
-
Total Revenue ($) by Booking Channel: Compares revenue from different sources such as Website, Mobile App, Travel Agencies, and Direct Bookings.
-
Total Revenue ($) by Location: Highlights the performance of properties or branches in different locations.
-
Total Bookings by Booking Channel: Identifies which platforms drive the most bookings.
-
Total Bookings by Location: Visualizes regional booking trends.
-
Total Bookings by Month: Tracks seasonal booking patterns and occupancy growth.
-
# of Nights Stayed by Service Used: Evaluates guest engagement based on services like Gym, Spa, or Room Service.
-
Average Guest Rating by Service Used: Compares guest satisfaction across services.
-
Total Revenue ($) by Room Type: Breaks down revenue by accommodation category to measure profitability.
All these charts update automatically when new data is entered, offering instant insights without any manual refresh.
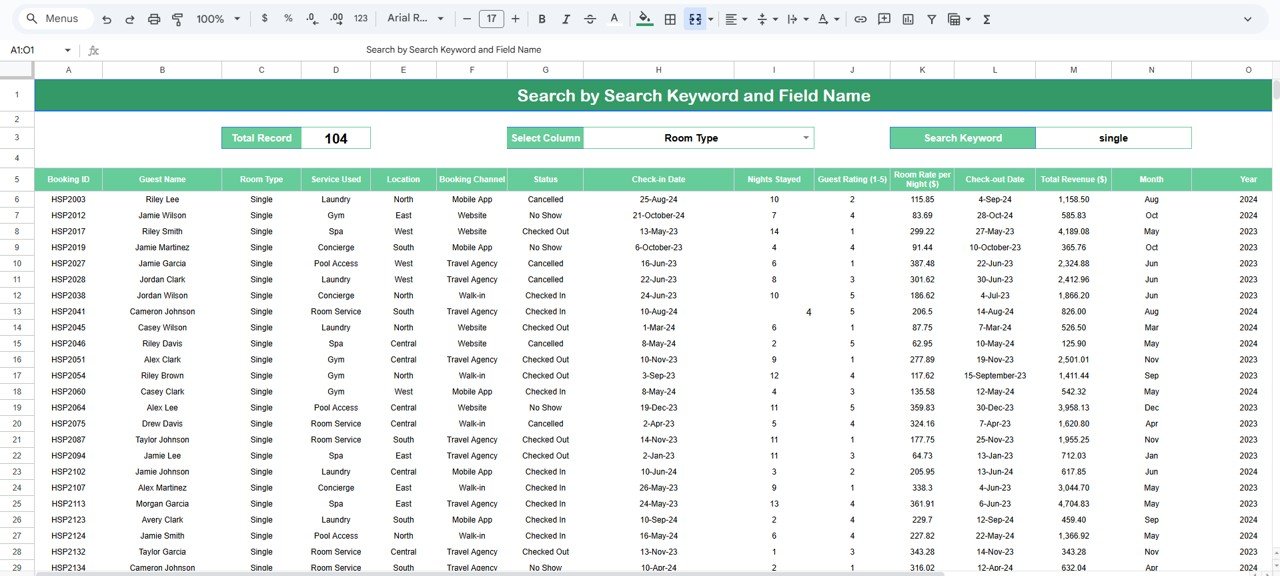
Search Sheet Tab
The Search Sheet makes it easy to find specific guest bookings or data points by keyword.
Examples:
-
Search “Status = Checked In” → Lists all active guests currently staying.
-
Search “Location = East” → Filters bookings from the East property.
-
Search “Room Type = Suite” → Displays bookings related to suites.
-
Search “Service Used = Spa” → Shows guests who used spa services.
This feature is ideal for quick lookups or customer service inquiries.
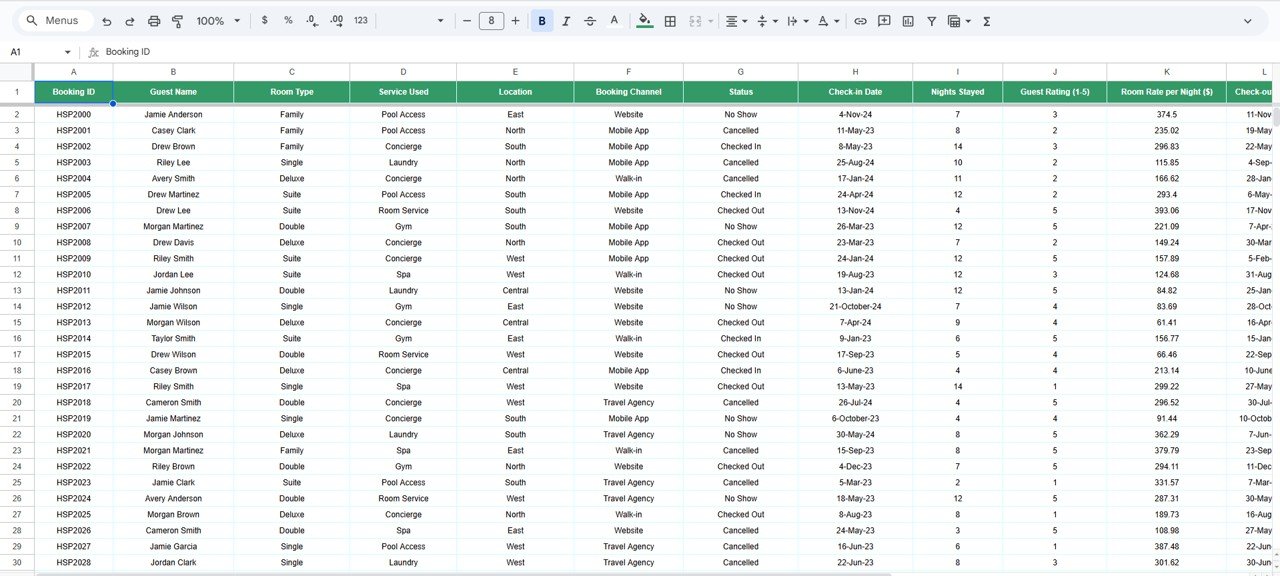
Data Sheet Tab
This is the core data source of the dashboard. All your booking, revenue, and rating data should be entered here.
Support Sheet Tab
The Support Sheet Tab holds reference lists and dropdown data such as:
Using standardized dropdowns ensures consistent data entry and more accurate reporting.
Advantages of the Dashboard
-
Real-Time Analytics: Get instant insights into booking trends and performance.
-
Centralized Data: Manage bookings, revenue, and guest feedback in one sheet.
-
Revenue Optimization: Track which room types or locations generate the most profit.
-
Customer Insights: Monitor guest satisfaction to identify service improvement areas.
-
Fully Automated: No coding or plugins required — just enter your data.
-
Cloud Collaboration: Accessible and editable by multiple users simultaneously.
Opportunities for Improvement
Enhance the dashboard by:
-
Adding Forecasting: Use formulas or scripts to project future bookings or revenue.
-
Integrating Google Forms: Automate guest feedback and booking data collection.
-
Applying Conditional Formatting: Highlight low ratings or high cancellation rates.
-
Including Expense Tracking: Compare revenue vs. operational costs for profitability analysis.
-
Incorporating Guest Demographics: Analyze age, nationality, or travel purpose trends.
Best Practices
-
Keep booking statuses updated daily.
-
Validate guest ratings before finalizing reports.
-
Regularly review top-performing room types and channels.
-
Use standardized date formats to avoid chart errors.
-
Back up your data monthly to preserve historical records.
Conclusion
The Hospitality & Guest Booking Performance Dashboard in Google Sheets is a powerful yet user-friendly solution that gives hospitality professionals the insights they need to improve operations, increase bookings, and deliver better guest experiences.
Watch the step-by-step video Demo:
Visit our YouTube channel to learn step-by-step video tutorials