Managing a car rental business requires close monitoring of fleet utilization, revenue, customer satisfaction, and maintenance costs. The Car Rental KPI Dashboard in Google Sheets is a ready-to-use, data-driven solution that simplifies performance tracking and decision-making for car rental companies, fleet managers, and franchise owners.
In this article, we’ll walk through the structure of the dashboard, key KPIs with formulas, and best practices for using it effectively to drive growth and profitability.
What Is a Car Rental KPI Dashboard in Google Sheets?
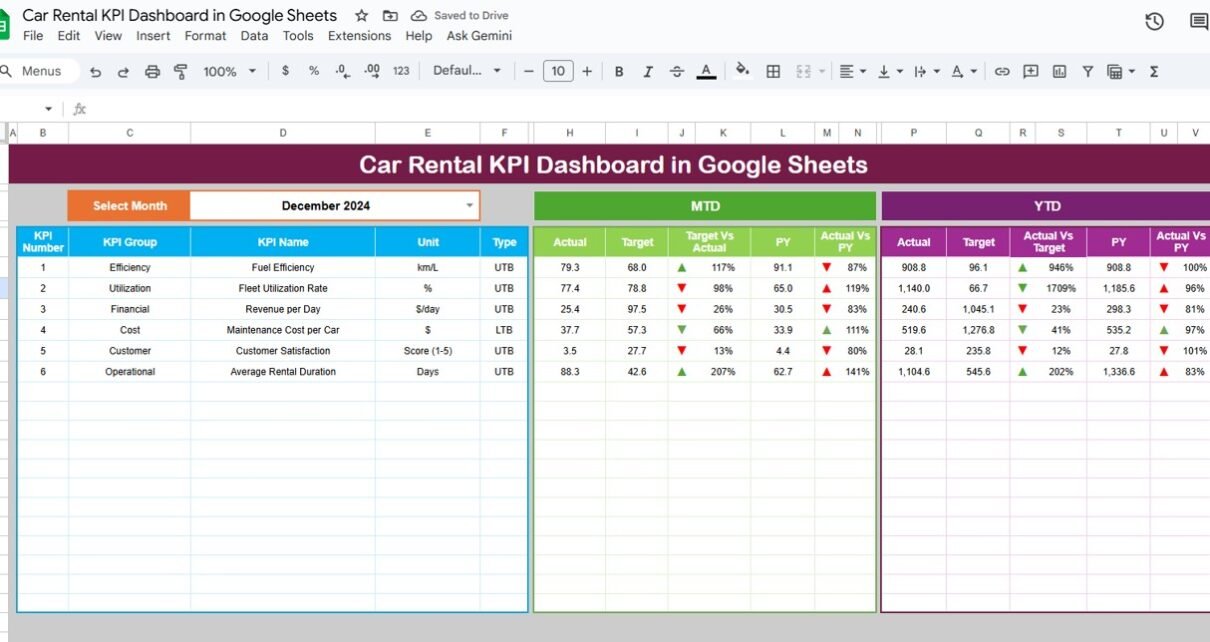
A Car Rental KPI Dashboard is a dynamic reporting tool built in Google Sheets that tracks and visualizes key performance indicators related to car rentals — such as revenue, utilization, maintenance cost, and customer feedback.
This dashboard automatically calculates Month-to-Date (MTD) and Year-to-Date (YTD) performance, compares it against targets and previous year results, and visually highlights performance trends using up/down arrows and conditional color formatting.
It’s ideal for car rental companies that want a real-time, cloud-based solution without investing in complex software.
Structure of the Dashboard
Click to Buy Car Rental KPI Dashboard in Google Sheets
The Car Rental KPI Dashboard in Google Sheets includes six well-organized sheets:
Dashboard Sheet Tab
This is the main visualization sheet, where all KPIs are displayed with interactive filters.
-
On Range D3, you can select the month from a dropdown list.
-
The dashboard automatically updates all cards, charts, and conditional indicators (arrows and colors).
-
Both MTD and YTD values are displayed, along with comparisons to Target and Previous Year (PY).

Click to Buy Car Rental KPI Dashboard in Google Sheets
KPI Trend Sheet Tab
This tab provides a deep-dive view of each KPI over time.
-
Select the KPI from a dropdown (available in Range C3).
-
The sheet shows the KPI Group, Unit, Formula, Definition, and Type (UTB or LTB).
-
Trend charts display monthly performance and highlight improvements or deviations.

Actual Number Sheet Tab
This sheet is where you enter monthly actual values for each KPI.
-
Columns include Month, MTD Actual, and YTD Actual.
-
The first month of the fiscal year can be changed in Range E1, and all formulas update automatically.

Click to Buy Car Rental KPI Dashboard in Google Sheets
Target Sheet Tab
Use this sheet to set monthly and yearly targets for each KPI.
-
The dashboard uses these targets for performance comparison and color-coded status indicators.

Previous Year Number Sheet Tab
This sheet is used for benchmarking historical data.
-
Enter the previous year’s values for each KPI to analyze YoY growth and improvements

Click to Buy Car Rental KPI Dashboard in Google Sheets
KPI Definition Sheet Tab
This tab defines each KPI, its calculation method, and its type (whether higher or lower values indicate better performance).

Advantages of the Car Rental KPI Dashboard
Click to Buy Car Rental KPI Dashboard in Google Sheets
-
All-in-One Dashboard: Consolidates all rental, revenue, and maintenance metrics in one place.
-
Real-Time Updates: Automatically updates when data changes.
-
Performance Visualization: Conditional arrows and color coding make it easy to interpret performance.
-
Historical Comparison: Enables year-over-year and target-based analysis.
-
Google Sheets Collaboration: Multiple users can update data simultaneously.
Opportunities for Improvement
You can enhance the dashboard further by:
-
Integrating Google Forms for capturing new booking data.
-
Adding Profit Margin Analysis (Revenue – Expenses).
-
Including Vehicle Maintenance Alerts using conditional logic.
-
Linking Customer Feedback Forms for live satisfaction updates.
-
Automating Reports with Google Apps Script for monthly summaries.
Best Practices
Click to Buy Car Rental KPI Dashboard in Google Sheets
-
Enter accurate monthly actuals and targets.
-
Protect formulas and dashboard visuals from editing.
-
Review fleet utilization and maintenance costs regularly.
-
Compare actuals against targets to identify underperforming KPIs.
-
Update the “Previous Year” sheet annually to maintain performance continuity.
Conclusion
Click to Buy Car Rental KPI Dashboard in Google Sheets
The Car Rental KPI Dashboard in Google Sheets is an efficient, automated solution that helps rental companies track fleet performance, operational efficiency, and customer satisfaction — all in one place.
With interactive data visualization, MTD/YTD metrics, and automatic comparison features, this dashboard empowers managers to make informed decisions, reduce costs, and enhance profitability.
Visit our YouTube channel to learn step-by-step video tutorials
Youtube.com/@NeotechNavigators