The consumer electronics industry thrives on precision — from tracking production efficiency and sales performance to monitoring warranty claims and customer satisfaction. The Consumer Electronics KPI Dashboard in Google Sheets is a ready-to-use solution designed to help electronics manufacturers, retailers, and distributors monitor these key business metrics with clarity and control.Consumer Electronics KPI Dashboard in Google Sheets
In this guide, we’ll explore the dashboard structure, all KPI definitions with formulas, units, and UTB/LTB indicators, and best practices for using this tool effectively.Consumer Electronics KPI Dashboard in Google Sheets
What Is a Consumer Electronics KPI Dashboard?
A Consumer Electronics KPI Dashboard in Google Sheets is an analytical system that consolidates manufacturing, sales, warranty, and customer data into one automated performance dashboard.
It provides real-time visibility into operational efficiency, product profitability, and market performance — all within a single Google Sheet.Consumer Electronics KPI Dashboard in Google Sheets
With built-in dropdowns, MTD/YTD comparisons, and dynamic charts, it eliminates manual reporting while supporting faster, data-driven decisions.Consumer Electronics KPI Dashboard in Google Sheets
Dashboard Structure
Click to Buy Consumer Electronics KPI Dashboard in Google Sheets
The Consumer Electronics KPI Dashboard in Google Sheets is organized into six structured worksheets:
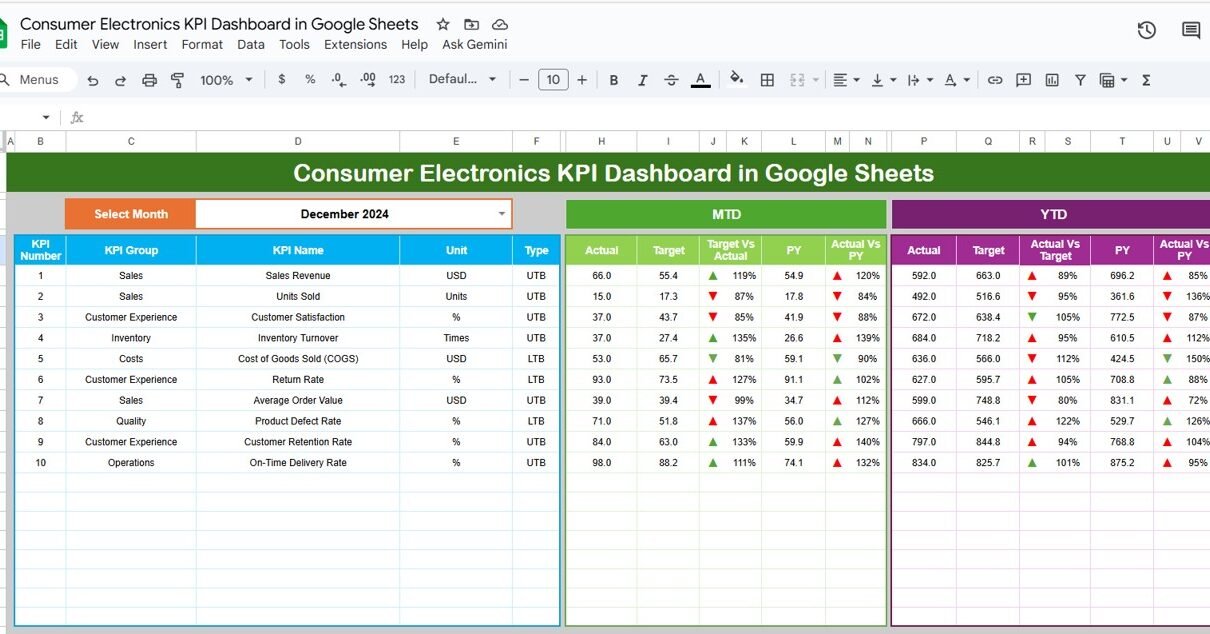
Dashboard Sheet Tab
This is the main dashboard page, where performance metrics are displayed as KPI cards and visual charts.
-
A month selector (at Range D3) allows you to pick any month — all KPIs and charts update instantly.
-
Displays both MTD (Month-to-Date) and YTD (Year-to-Date) values.
-
Conditional formatting highlights whether each KPI meets or misses its target (green ↑ for good, red ↓ for below target)

Click to Buy Consumer Electronics KPI Dashboard in Google Sheets
KPI Trend Sheet Tab
This sheet helps analyze how each KPI performs over time.
-
A dropdown in Range C3 lets you select the KPI you want to review.
-
Displays its KPI Group, Unit, Formula, Definition, and Type (UTB/LTB).
-
Trend charts visualize MTD and YTD changes across months.

Actual Number Sheet Tab
This is the data entry sheet for MTD and YTD actuals.
-
Enter monthly actual performance for each KPI.
-
Adjust the fiscal start month in Range E1 (e.g., Jan, Apr).

Click to Buy Consumer Electronics KPI Dashboard in Google Sheets
Target Sheet Tab
Input the target values for each KPI — both MTD and YTD.
The dashboard uses these to calculate percentage achievement and display color-coded performance indicators.

Previous Year Number Sheet Tab
Enter last year’s data here to enable YoY (Year-over-Year) performance comparison and trend analysis.

Click to Buy Consumer Electronics KPI Dashboard in Google Sheets
KPI Definition Sheet Tab
This sheet defines each KPI clearly, including its group, unit, formula, definition, and whether higher or lower values indicate better performance.

Advantages of the Dashboard
Click to Buy Consumer Electronics KPI Dashboard in Google Sheets
-
Comprehensive Coverage: Tracks KPIs from production to customer service.
-
Real-Time Insights: Updates automatically when data changes.
-
Performance Comparison: Evaluates MTD vs. YTD vs. PY values with one click.
-
Visual Analysis: Conditional formatting helps identify strengths and problem areas.
-
Google Sheets Collaboration: Accessible to teams across departments for joint updates.
Opportunities for Improvement
Enhance your dashboard further by:
-
Integrating Google Forms for real-time customer feedback.
-
Adding Forecasting Metrics like sales prediction based on historical data.
-
Including Regional Breakdown Charts for location-based analysis.
-
Automating Performance Alerts using Google Apps Script.
-
Linking Maintenance Logs to monitor defect patterns by batch.
Best Practices
Click to Buy Consumer Electronics KPI Dashboard in Google Sheets
-
Keep data entry consistent across all months.
-
Protect the dashboard sheet to avoid accidental formula edits.
-
Review targets quarterly to reflect market changes.
-
Maintain a backup of historical data annually.
-
Use pivot charts for department-level KPI analysis if needed.
Conclusion
Click to Buy Consumer Electronics KPI Dashboard in Google Sheets
The Consumer Electronics KPI Dashboard in Google Sheets gives electronics businesses a complete view of their operational, financial, and customer performance.
With built-in automation, visual insights, and monthly trend tracking, it’s a powerful yet simple solution to boost transparency, accountability, and profitability.
Visit our YouTube channel to learn step-by-step video tutorials
Youtube.com/@NeotechNavigators
Watch the step-by-step video Demo:
Click to Buy Consumer Electronics KPI Dashboard in Google Sheets