Advertising plays a crucial role in modern business growth. Companies invest heavily in digital advertising, social media campaigns, search engine marketing, and display ads to attract customers and generate revenue. However, running advertising campaigns alone does not guarantee success. Businesses must continuously track campaign performance to understand what works and what needs improvement.
Many marketing teams still rely on scattered spreadsheets and manual reports to analyze advertising performance. As a result, it becomes difficult to measure campaign results accurately. Managers often struggle to monitor key metrics such as conversions, cost efficiency, and campaign profitability.
Therefore, organizations need a simple yet powerful system to track advertising performance clearly.
This is where the Advertising KPI Scorecard in Google Sheets becomes extremely valuable.
The Advertising KPI Scorecard in Google Sheets is a ready-to-use template designed to track and analyze marketing performance using key performance indicators (KPIs). With automated calculations, visual indicators, and structured data sheets, the scorecard helps marketing teams monitor campaign success and make better decisions.
In this article, you will learn what an Advertising KPI Scorecard in Google Sheets is, why businesses need it, how it works, its key features, advantages, best practices, and frequently asked questions.
What is an Advertising KPI Scorecard in Google Sheets?
Click to Buy Advertising KPI Scorecard in Google Sheets
An Advertising KPI Scorecard in Google Sheets is a performance monitoring tool that helps businesses evaluate the effectiveness of their advertising campaigns.
The scorecard tracks multiple advertising metrics and displays them in a structured format using tables, visual indicators, and trend analysis.
In this template, 10 different KPIs are used to measure advertising performance. These KPIs help marketing teams monitor campaign effectiveness, advertising costs, engagement levels, and revenue performance.
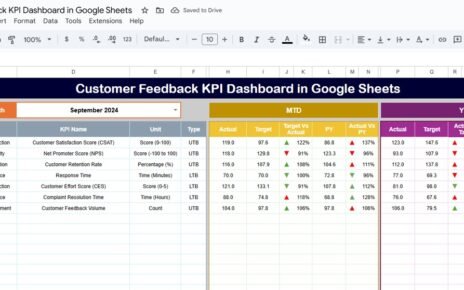
The scorecard includes a month dropdown selection that allows users to analyze performance for any selected month. Once the user selects a month, the scorecard automatically updates all KPI numbers, visual indicators, and performance comparisons.
Additionally, the scorecard includes traffic light indicators and arrow symbols that highlight performance changes. These visual elements help users quickly understand whether a KPI is performing well or requires improvement.
Furthermore, users can easily switch between MTD (Month-to-Date) and YTD (Year-to-Date) performance analysis.
Because of these features, the Advertising KPI Scorecard becomes a powerful yet simple marketing performance tool.
Why Do Businesses Need an Advertising KPI Scorecard?
Advertising campaigns generate large amounts of data. Marketing teams track metrics such as impressions, clicks, conversions, revenue, and cost per acquisition. Without a proper tracking system, analyzing this data becomes difficult.
Many organizations face several challenges when they do not use a structured KPI scorecard.
For example:
- Marketing data remains scattered across multiple files
- Performance comparisons become difficult
- Campaign efficiency becomes unclear
- Decision-making becomes slower
Therefore, businesses require a centralized analytics tool.
The Advertising KPI Scorecard in Google Sheets solves these problems by providing a clear and organized performance monitoring system. It allows marketing managers to track KPIs, compare performance trends, and evaluate campaign results effectively.
As a result, businesses can optimize their advertising strategies and improve marketing return on investment.
Key Features of the Advertising KPI Scorecard in Google Sheets
Click to Buy Advertising KPI Scorecard in Google Sheets
The template includes multiple sheets that organize advertising data, KPI definitions, and performance analysis.
Each sheet serves a specific purpose and helps users analyze advertising performance efficiently.
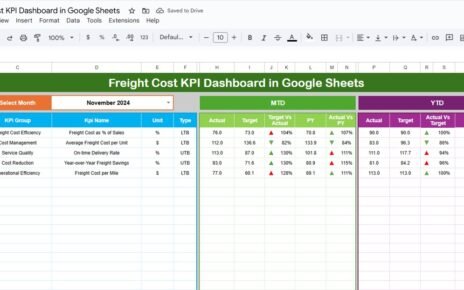
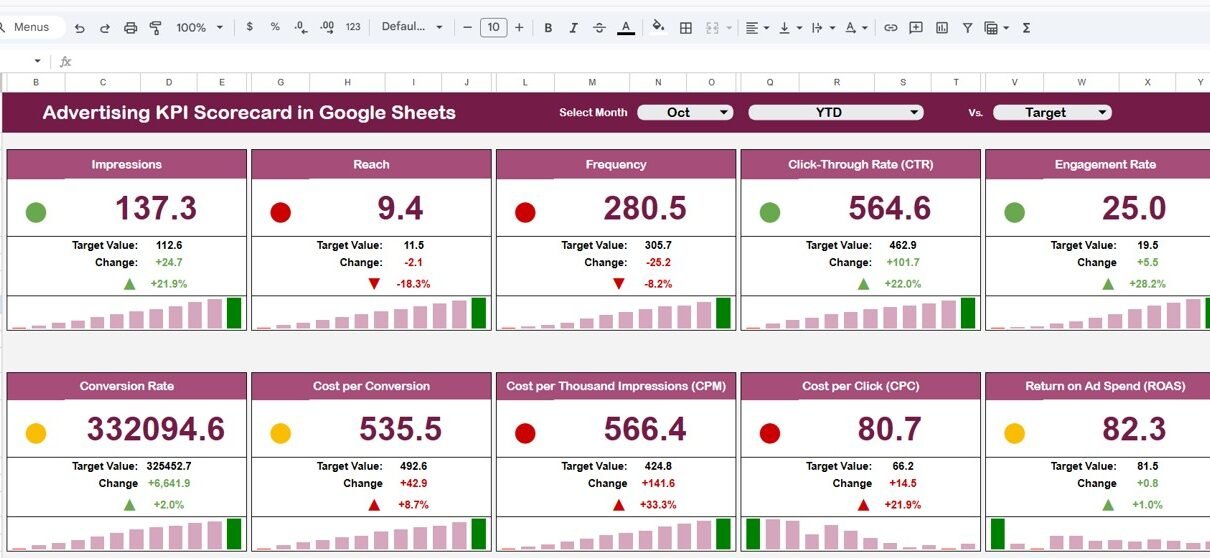
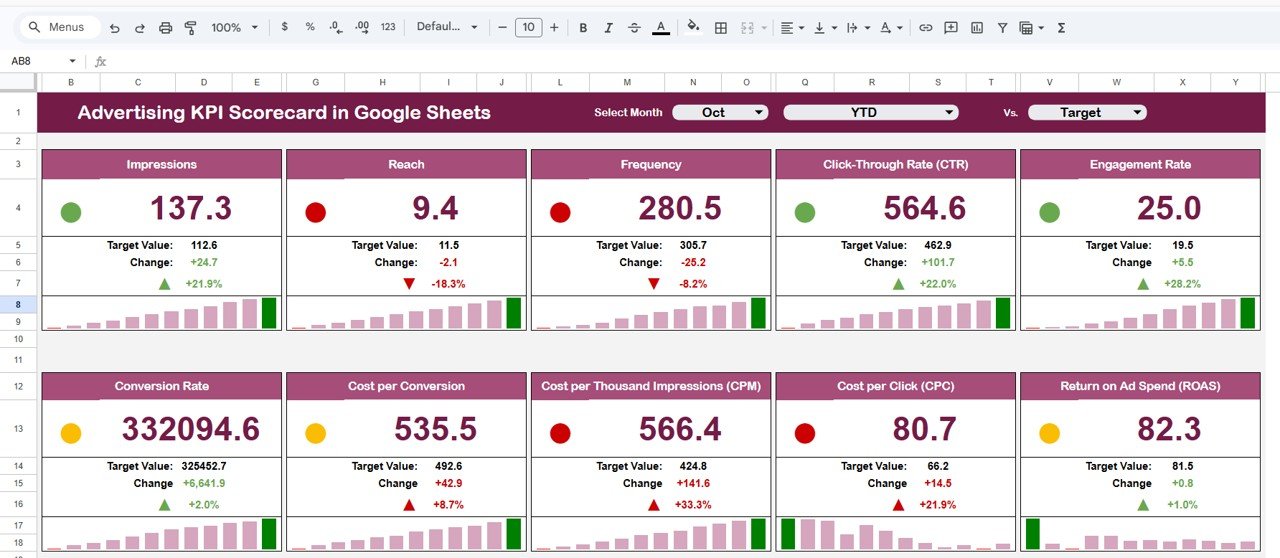
1. Scorecard Sheet – The Main KPI Dashboard
The Scorecard Sheet serves as the main dashboard where users can view the performance of all KPIs in one place.
This sheet provides a clear overview of advertising performance and highlights important metrics visually.
Month Selection Dropdown
At the top of the scorecard, users can select any month from a dropdown menu.
Once a month is selected:
-
All KPI values update automatically
-
Performance comparisons update instantly
-
Visual indicators refresh automatically
This feature allows users to create a monthly advertising scorecard without manual calculations.
Traffic Light Performance Indicators
The scorecard uses traffic light colors to display KPI performance.
These indicators include:
-
Green – KPI meets or exceeds the target
-
Yellow – KPI performs close to the target
-
Red – KPI performs below expectations
Because of these visual indicators, users can quickly identify performance issues.
Performance Change Arrows
The template also includes up and down arrows that show the percentage change in KPI performance.
For example:
-
An upward arrow indicates improvement
-
A downward arrow indicates declining performance
This feature helps marketing managers quickly understand trends.
MTD and YTD Analysis
Users can analyze data using two different perspectives:
MTD (Month-to-Date)
Shows performance for the selected month.
YTD (Year-to-Date)
Shows cumulative performance for the entire year.
This flexibility allows businesses to analyze both short-term and long-term performance.
Click to Buy Advertising KPI Scorecard in Google Sheets
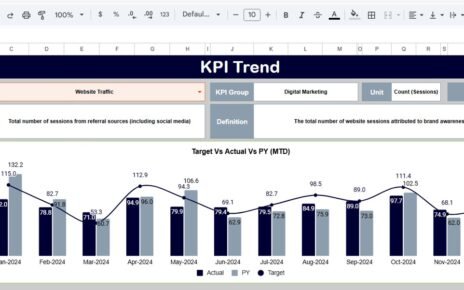
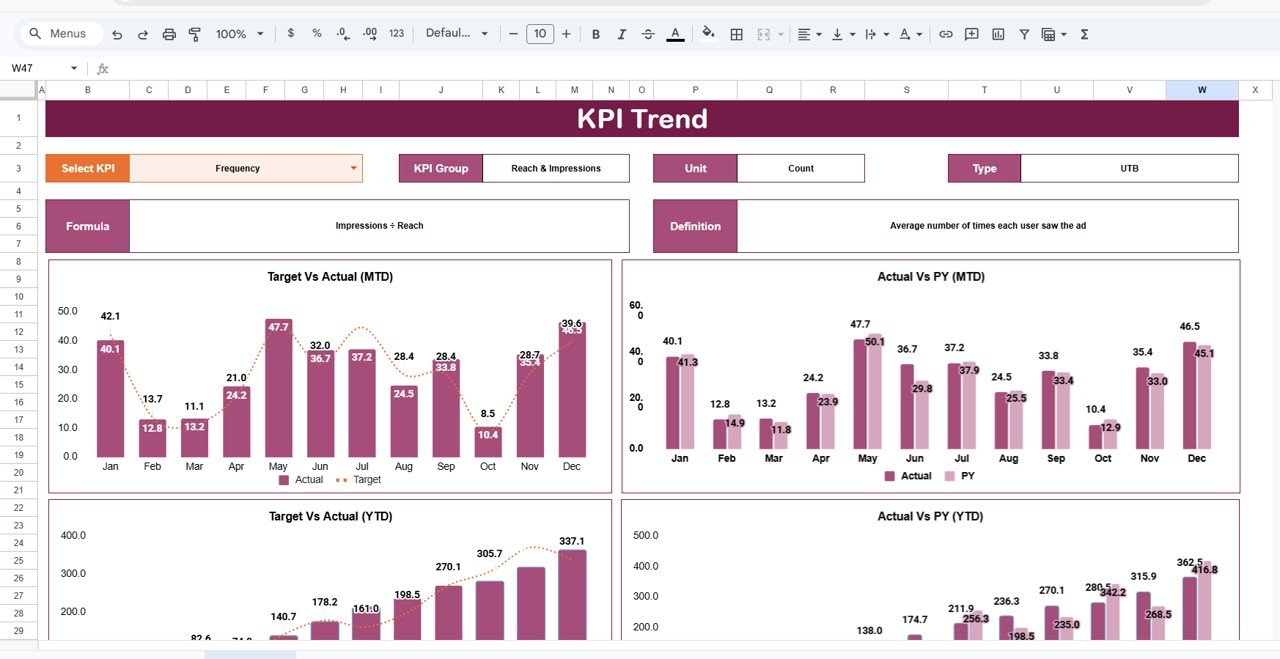
2. Trend Sheet Tab – Visual KPI Performance Trends
The Trend Sheet allows users to analyze the historical trend of each KPI.
In this sheet, users can select a KPI from the dropdown available in cell C3. Once a KPI is selected, the sheet displays the trend chart showing performance over time.
The sheet also displays important KPI information such as:
-
KPI Group
-
KPI Unit
-
KPI Type
The KPI type indicates whether:
-
Higher values are better, or
-
Lower values are better
For example:
-
Higher conversion rates indicate better performance
-
Lower cost per click indicates better efficiency
This context helps users interpret KPI results accurately.
Click to Buy Advertising KPI Scorecard in Google Sheets
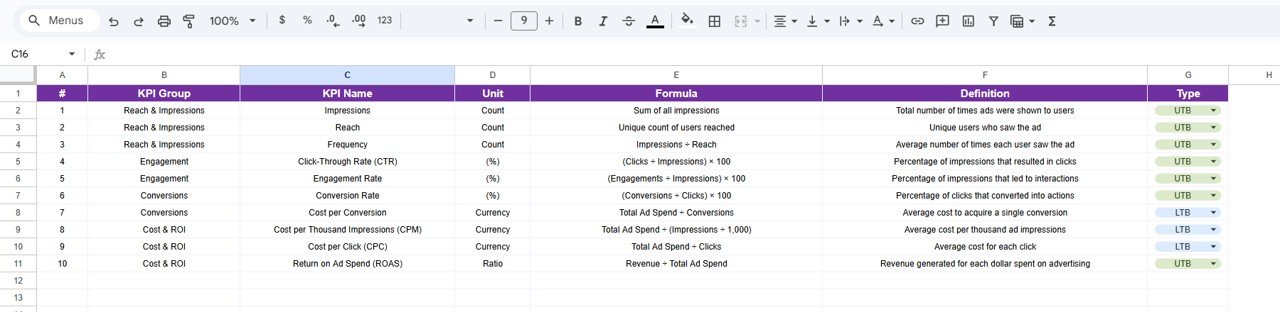
3. KPI Definition Sheet – Central KPI Documentation
The KPI Definition Sheet acts as a reference sheet where all KPI information is stored.
This sheet includes details such as:
- KPI Name
- KPI Group
- KPI Unit
- KPI Formula
- KPI Definition
Because of this structured documentation, teams can easily understand how each KPI works.
Additionally, this sheet ensures consistency when multiple users work with the scorecard.
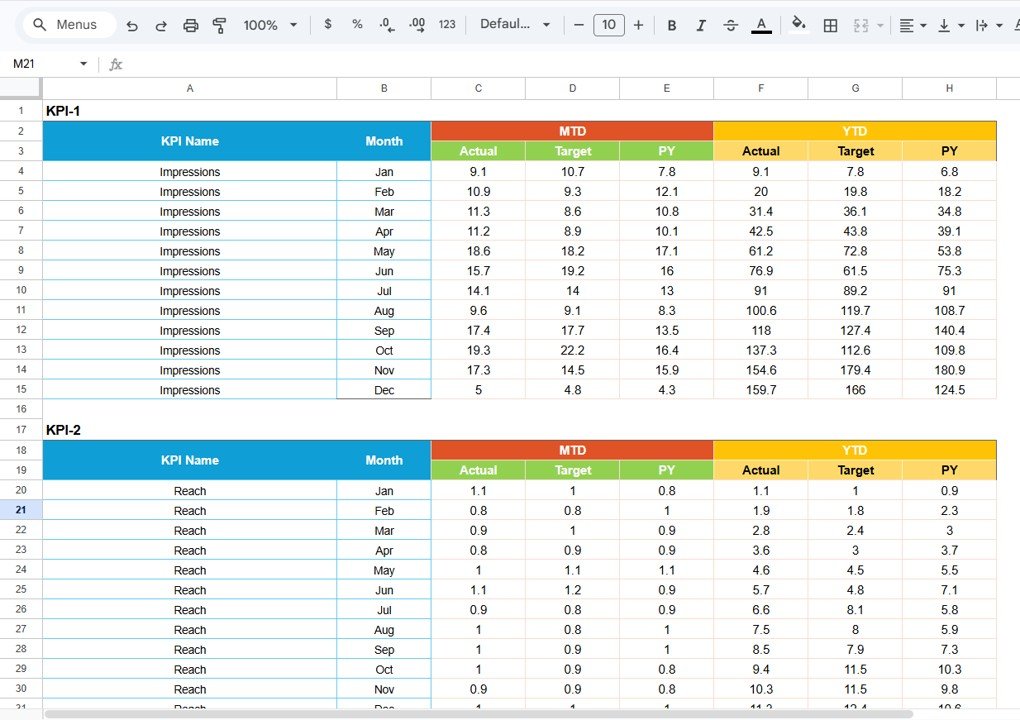
4. Data Input Sheet – Enter Advertising Data
The Data Input Sheet is where users enter the raw advertising data.
Users simply input campaign performance metrics in this sheet.
Once the data is entered, the scorecard automatically calculates KPI values and updates the dashboard.
This design ensures that the scorecard remains easy to maintain and update.
Click to Buy Advertising KPI Scorecard in Google Sheets
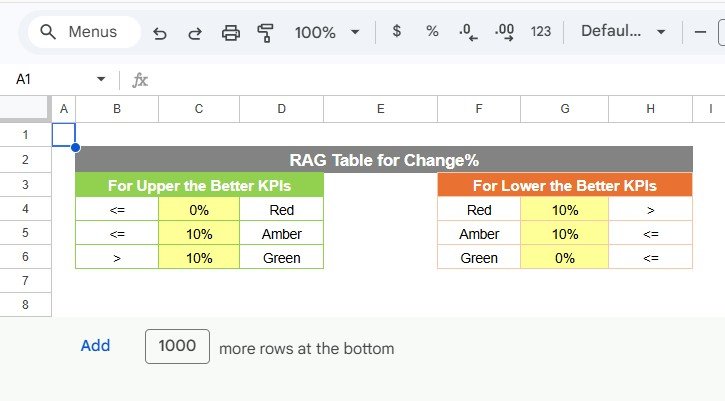
5. Colour Settings – Customize KPI Visual Indicators
The Colour Settings section controls the traffic light performance indicators used in the scorecard.
Users can customize:
- Performance thresholds
- Traffic light colors
- KPI performance conditions
This flexibility allows businesses to align the scorecard with their performance targets.
Click to Buy Advertising KPI Scorecard in Google Sheets
Important Advertising KPIs Tracked in the Scorecard
The Advertising KPI Scorecard typically tracks several important marketing metrics.
These KPIs may include:
Campaign Performance KPIs
- Impressions
- Clicks
- Click-Through Rate (CTR)
- Conversion Rate
Cost Efficiency KPIs
- Cost Per Click (CPC)
- Cost Per Acquisition (CPA)
- Advertising Spend
Revenue KPIs
- Revenue from Campaigns
- Return on Advertising Spend (ROAS)
- Profit Margin from Advertising
Tracking these KPIs helps businesses evaluate campaign effectiveness.
Advantages of Advertising KPI Scorecard in Google Sheets
Click to Buy Advertising KPI Scorecard in Google Sheets
Using an Advertising KPI Scorecard provides many advantages for marketing teams.
Centralized Marketing Performance Tracking
The scorecard brings all advertising metrics into one place. Therefore, teams no longer need to analyze multiple spreadsheets.
Easy Monthly Performance Analysis
The month selection dropdown allows quick monthly performance review.
Clear Visual Indicators
Traffic lights and arrows help users understand performance instantly.
Better Decision Making
Managers can identify underperforming campaigns and adjust strategies quickly.
Simple Collaboration
Since Google Sheets is cloud-based, multiple team members can access and update the scorecard easily.
Best Practices for the Advertising KPI Scorecard in Google Sheets
Click to Buy Advertising KPI Scorecard in Google Sheets
To achieve the best results, businesses should follow several best practices.
Select the Right KPIs
Choose KPIs that directly reflect campaign success and marketing objectives.
Maintain Accurate Data Entry
Ensure that advertising data entered in the Data Input sheet remains accurate and updated.
Review KPIs Regularly
Analyze the scorecard regularly to detect performance trends and opportunities.
Use Consistent KPI Definitions
Clearly define each KPI so that all team members interpret metrics correctly.
Monitor Trends Alongside Monthly Results
Always review KPI trends to understand long-term performance patterns.
How Can Businesses Use This Scorecard to Improve Advertising Results?
Marketing teams can use the scorecard in several ways.
For example:
- Monitor advertising campaign performance
- Identify high-performing marketing channels
- Control advertising costs
- Improve conversion rates
- Optimize marketing strategies
Because the scorecard provides clear insights, businesses can make data-driven decisions.
Conclusion
Click to Buy Advertising KPI Scorecard in Google Sheets
Advertising campaigns generate valuable data, but without proper analysis tools, businesses cannot fully benefit from that information.
The Advertising KPI Scorecard in Google Sheets provides a simple yet powerful solution for monitoring marketing performance. With automated KPI calculations, visual performance indicators, and structured analysis sheets, the scorecard makes advertising analytics easy to understand.
Moreover, features such as monthly analysis, trend tracking, KPI definitions, and customizable visual indicators make this template highly practical for marketing teams.
Organizations that use structured KPI scorecards can improve campaign efficiency, control advertising costs, and achieve better marketing results.
Frequently Asked Questions (FAQs)
What is an Advertising KPI Scorecard?
An Advertising KPI Scorecard is a performance tracking tool that helps businesses monitor key marketing metrics such as clicks, conversions, costs, and revenue.
Why should businesses use Google Sheets for KPI tracking?
Google Sheets provides cloud-based collaboration, easy data management, and automated calculations, making it ideal for KPI tracking.
What is the difference between MTD and YTD analysis?
MTD (Month-to-Date) shows performance for the current month, while YTD (Year-to-Date) shows cumulative performance for the entire year.
Visit our YouTube channel to learn step-by-step video tutorials
Youtube.com/@NeotechNavigators
Watch the step-by-step video tutorial: