Budget control plays a critical role in every organization’s financial health. However, many teams still manage budgets using multiple spreadsheets, manual calculations, and static reports. As a result, budget overruns remain unnoticed until it is too late, and decision-making becomes reactive instead of proactive.
That is exactly where a Budget Performance Dashboard in Google Sheets creates real value.
In this article, we will explain the Budget Performance Dashboard in Google Sheets, which is a ready-to-use dashboard built entirely in Google Sheets. You will learn what this dashboard is, how it works, its page-wise structure, key insights, advantages, best practices, and frequently asked questions. By the end, you will clearly understand how this dashboard helps finance and business teams track budget performance accurately and efficiently.
What Is a Budget Performance Dashboard in Google Sheets?
Click to Buy Budget Performance Dashboard in Google Sheets
A Budget Performance Dashboard in Google Sheets is an interactive financial reporting tool designed to monitor budget amount, forecast amount, actual spending, and variance across departments, categories, budget status, and time periods.
Instead of reviewing raw numbers or long financial reports, this dashboard presents budget data using KPI cards, charts, trends, and slicers. Moreover, because it is built in Google Sheets, teams can collaborate in real time and access the dashboard from anywhere.
As a result, finance teams gain instant visibility into how budgets perform against forecasts and actuals.
Why Is a Budget Performance Dashboard Important?
Budget monitoring directly impacts cost control, profitability, and strategic planning. Therefore, having a clear and dynamic view of budget performance is essential.
Here is why a Budget Performance Dashboard matters:
- It provides a clear overview of budget vs actual performance
- It highlights over-budget and under-budget areas instantly
- It improves financial transparency across departments
- It supports faster corrective actions
- It reduces dependency on manual budget reports
Because Google Sheets is cloud-based, everyone works with the same updated financial data.
How Does the Budget Performance Dashboard in Google Sheets Work?
Click to Buy Budget Performance Dashboard in Google Sheets
This dashboard works by combining structured financial data with interactive visualizations.
First, budget, forecast, and actual data are captured in a structured data table. Then, formulas and pivot-based logic calculate variances and budget status. After that, charts and KPI cards display the insights visually. Finally, slicers allow users to filter the dashboard by year, month, department, category, budget status, and date.
Because of this structure, users analyze financial performance without complex calculations.
What Key KPIs Are Tracked in the Dashboard?
The Budget Performance Dashboard in Google Sheets tracks essential financial KPIs.
Core KPIs Displayed
- Budget Amount
- Forecast Amount
- Actual Amount
- Variance Amount
- Under Budget Count
- Over Budget Count
- On Track Budget Count
These KPIs provide a complete snapshot of financial performance.
What Pages Are Included in the Budget Performance Dashboard?
Click to Buy Budget Performance Dashboard in Google Sheets
This ready-to-use dashboard includes multiple analytical pages. Each page focuses on a different dimension of budget performance.
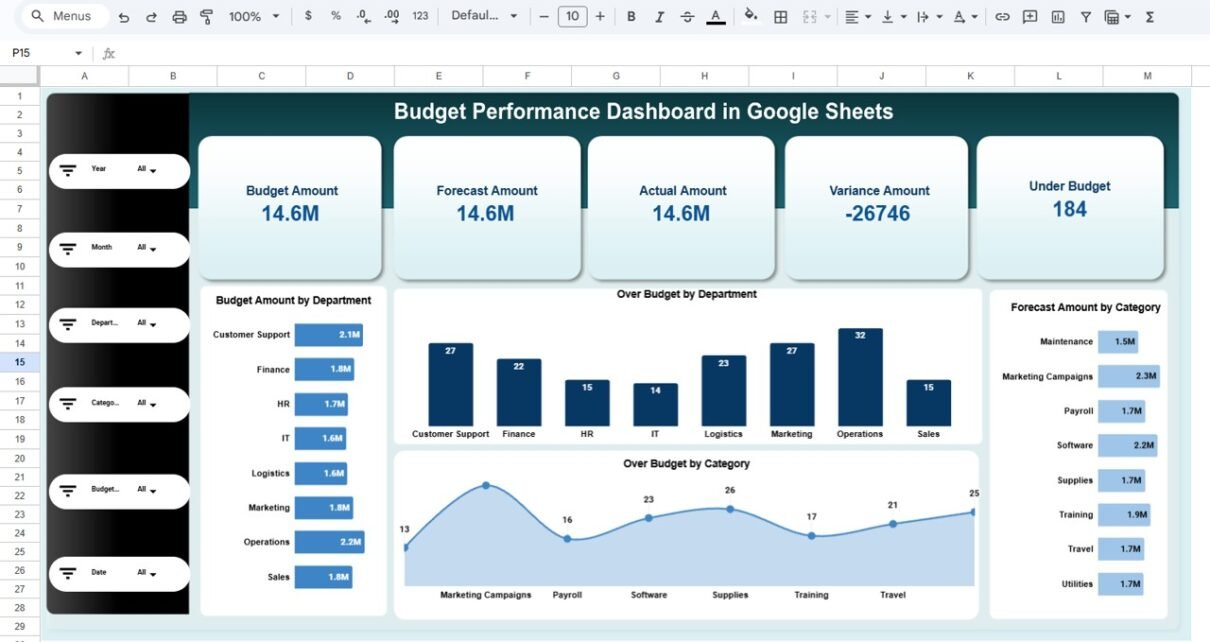
Budget Performance Overview Page
The Budget Performance Overview Page acts as the main dashboard.
Key Features of the Overview Page
- KPI cards showing Budget, Forecast, Actual, Variance, and Under Budget count
- Filters for Year, Month, Department, Category, Budget Status, and Date
- Department-wise budget distribution
-
Over-budget analysis by department and category
Key Charts on the Overview Page
- Budget Amount by Department
- Over Budget by Department
- Over Budget by Category
- Forecast Amount by Category
Because everything appears in one place, decision-makers quickly understand overall budget health.

Click to Buy Budget Performance Dashboard in Google Sheets
Category Analysis Page
The Category Analysis Page focuses on expense and budget categories.
Key Insights
- Forecast Amount by Category
- Budget Amount by Category
- Actual Amount by Category
- Variance Amount by Category
This page helps identify which expense categories contribute most to budget overruns or savings.

Click to Buy Budget Performance Dashboard in Google Sheets
Department Analysis Page
The Department Analysis Page highlights financial performance across departments.
Key Insights
-
Actual Amount by Department
-
Budget Amount by Department
-
Forecast Amount by Department
-
Variance Amount by Department
Because departments manage different cost structures, this page supports department-level accountability.

Click to Buy Budget Performance Dashboard in Google Sheets
Budget Analysis Page?
The Budget Analysis Page focuses on budget status classification.
Budget Status Categories
-
On Track
-
Over Budget
-
Under Budget
Key Insights
-
Budget Amount by Budget Status
-
Forecast Amount by Budget Status
-
Actual Amount by Budget Status
-
Variance Amount by Budget Status
This page makes it easy to see where financial attention is required.

Click to Buy Budget Performance Dashboard in Google Sheets
Monthly Trends Page
The Monthly Trends Page tracks budget performance over time.
Key Insights
- Forecast Amount by Month
- Budget Amount by Month
- Actual Amount by Month
- Variance Amount by Month
Because trends matter in financial planning, this page highlights seasonal spending patterns and emerging risks.

Click to Buy Budget Performance Dashboard in Google Sheets
Search and Data Sheet?
The dashboard also includes a Search by Keyword and Field Name sheet.
Key Features
- Search financial records using keywords
- Filter data by selected columns
- View detailed transaction-level records
- Track budget approval and status flags
This sheet supports audits, validations, and detailed financial analysis.

Click to Buy Budget Performance Dashboard in Google Sheets
Advantages of Budget Performance Dashboard in Google Sheets
Using this dashboard delivers strong financial and operational benefits.
Key Advantages
- Centralized Budget Monitoring
- Real-Time Financial Visibility
- Clear Budget vs Actual Comparison
- Department and Category-Level Insights
- Easy Filtering and Drill-Down
- No Expensive BI Tools Required
Because of these advantages, finance teams manage budgets more effectively.
Best Practices for the Budget Performance Dashboard in Google Sheets
Click to Buy Budget Performance Dashboard in Google Sheets
Follow these best practices to maximize dashboard value.
1. Update Data Regularly
Ensure budget and actual data stay current.
2. Review Variances Monthly
Focus on high-variance categories and departments.
3. Use Filters Before Decisions
Always apply slicers before interpreting numbers.
4. Protect Calculation Sheets
Lock formulas and core logic to prevent errors.
5. Align Forecasts with Actual Trends
Use monthly trend insights for better forecasting.
Conclusion
A Budget Performance Dashboard in Google Sheets is a powerful and practical solution for tracking budgets, forecasts, and actual spending. It brings together financial KPIs, department analysis, category insights, budget status, and monthly trends into one interactive dashboard.
Visit our YouTube channel to learn step-by-step video tutorials
Youtube.com/@NeotechNavigators
Watch the step-by-step video tutorial: