Every organization generates massive volumes of data every day. However, data alone never creates value unless teams convert it into meaningful insights. Because of this challenge, business leaders increasingly rely on structured dashboards that track performance clearly and consistently. A Business Intelligence KPI Dashboard in Google Sheets provides a simple yet powerful solution to monitor key metrics, identify trends, and support data-driven decision-making.
This ready-to-use dashboard allows organizations to track performance using well-defined KPIs, monthly and yearly comparisons, trend analysis, and visual indicators. Since it runs entirely in Google Sheets, it remains flexible, collaborative, and cost-effective.
In this article, we will explain the structure of the Business Intelligence KPI Dashboard, its worksheet design, complete KPI list with formulas and definitions, advantages, improvement opportunities, best practices, and frequently asked questions.
What Is a Business Intelligence KPI Dashboard in Google Sheets?
A Business Intelligence KPI Dashboard in Google Sheets is a centralized reporting system that tracks performance across finance, operations, sales, efficiency, and productivity metrics. Instead of working with multiple reports and scattered spreadsheets, teams view all KPIs in one interactive dashboard.
This dashboard helps organizations:
-
Monitor business performance continuously
-
Compare actual results with targets
-
Analyze Month-to-Date (MTD) and Year-to-Date (YTD) metrics
-
Track historical trends
-
Identify risks and improvement areas
Because the dashboard uses Google Sheets, it supports real-time updates, collaboration, and easy customization without any technical dependency.
Key Worksheets in the Business Intelligence KPI Dashboard
Click to Buy Business Intelligence KPI Dashboard in Google Sheets
The dashboard contains 6 structured worksheets, each designed to support accurate analysis and reporting.
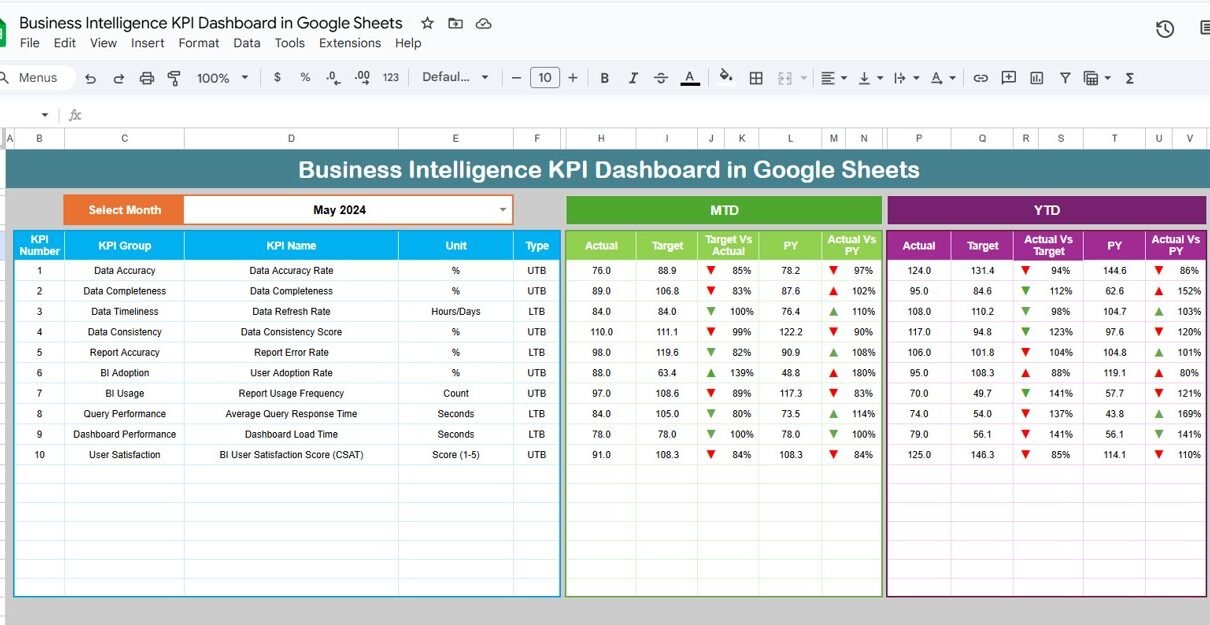
Dashboard Sheet Tab (Main Dashboard)
This is the primary analytical view of the dashboard.
You select the reporting month from the dropdown in cell D3, and the entire dashboard updates automatically.
This sheet displays:
MTD (Month-to-Date)
-
Actual
-
Target
-
Previous Year
-
Target vs Actual
-
Previous Year vs Actual
YTD (Year-to-Date)
-
Actual
-
Target
-
Previous Year
-
Target vs Actual
-
Previous Year vs Actual
Conditional formatting with up and down arrows highlights performance instantly:
-
Green arrow → improvement
-
Red arrow → decline
This sheet becomes ideal for management reviews and performance meetings.

Click to Buy Business Intelligence KPI Dashboard in Google Sheets
KPI Trend Sheet Tab
This sheet focuses on KPI-level trend analysis.
You select a KPI name from the dropdown in cell C3.
The sheet displays:
-
KPI Group
-
KPI Unit
-
KPI Type (Lower the Better / Upper the Better)
-
KPI Formula
-
KPI Definition
It also shows month-wise trends, helping teams understand performance movement over time.

Click to Buy Business Intelligence KPI Dashboard in Google Sheets
Actual Number Sheet Tab
This sheet stores actual KPI values for MTD and YTD.
-
Select the first month of the year in cell E1
-
Enter monthly actual values
-
Dashboard calculations update automatically
This structure ensures consistency across months.

Click to Buy Business Intelligence KPI Dashboard in Google Sheets
Target Sheet Tab
This sheet contains MTD and YTD target values for every KPI.
Targets help organizations:
-
Measure performance gaps
-
Set realistic goals
-
Align KPIs with business objectives

Click to Buy Business Intelligence KPI Dashboard in Google Sheets
Previous Year Number Sheet Tab
This sheet stores last year’s KPI values.
The dashboard uses this data to compare current performance against historical benchmarks.

KPI Definition Sheet Tab
This is the foundation of the entire dashboard.
It includes:
-
KPI Name
-
KPI Group
-
Unit
-
Formula
-
KPI Definition
-
KPI Type (LTB / UTB)
This sheet ensures clarity, transparency, and consistency across teams.

Click to Buy Business Intelligence KPI Dashboard in Google Sheets
Advantages of Business Intelligence KPI Dashboard in Google Sheets
-
Centralized performance tracking
-
Real-time KPI monitoring
-
Faster and better decisions
-
Reduced reporting effort
-
Improved transparency
-
Cost-effective BI solution
-
Easy customization
Opportunities for Improvement in BI KPI Tracking
Click to Buy Business Intelligence KPI Dashboard in Google Sheets
-
Integrate automated data sources
-
Add predictive analytics
-
Implement role-based dashboards
-
Enhance visualization with alerts
-
Add department-specific KPI views
-
Include AI-driven insights
Best Practices for Using BI KPI Dashboards
-
Define KPIs clearly before tracking
-
Update data consistently
-
Review KPIs monthly and quarterly
-
Train users on KPI interpretation
-
Use trends, not just single values
-
Align KPIs with business strategy
Conclusion
Click to Buy Business Intelligence KPI Dashboard in Google Sheets
A Business Intelligence KPI Dashboard in Google Sheets transforms raw data into actionable insights. It helps organizations track performance, identify risks, and improve efficiency without investing in complex BI tools. Because it offers MTD, YTD, trend analysis, and KPI benchmarking in one place, it becomes an essential performance management tool for modern businesses.
Frequently Asked Questions (FAQs)
1. Who should use a BI KPI Dashboard?
Executives, managers, analysts, and operations teams.
2. Can I customize KPIs?
Yes, the KPI Definition sheet allows full customization.
3. Does this dashboard support multi-year analysis?
Yes, using the Previous Year sheet.
4. Is Google Sheets secure for BI reporting?
Yes, with proper access controls.
5. Can it replace Power BI or Tableau?
It works as a lightweight BI alternative for many teams.
6. Do I need coding knowledge?
No, basic Google Sheets skills are enough.
Visit our YouTube channel to learn step-by-step video tutorials
Youtube.com/@NeotechNavigators
Watch the step-by-step video tutorial:
Click to Buy Business Intelligence KPI Dashboard in Google Sheets