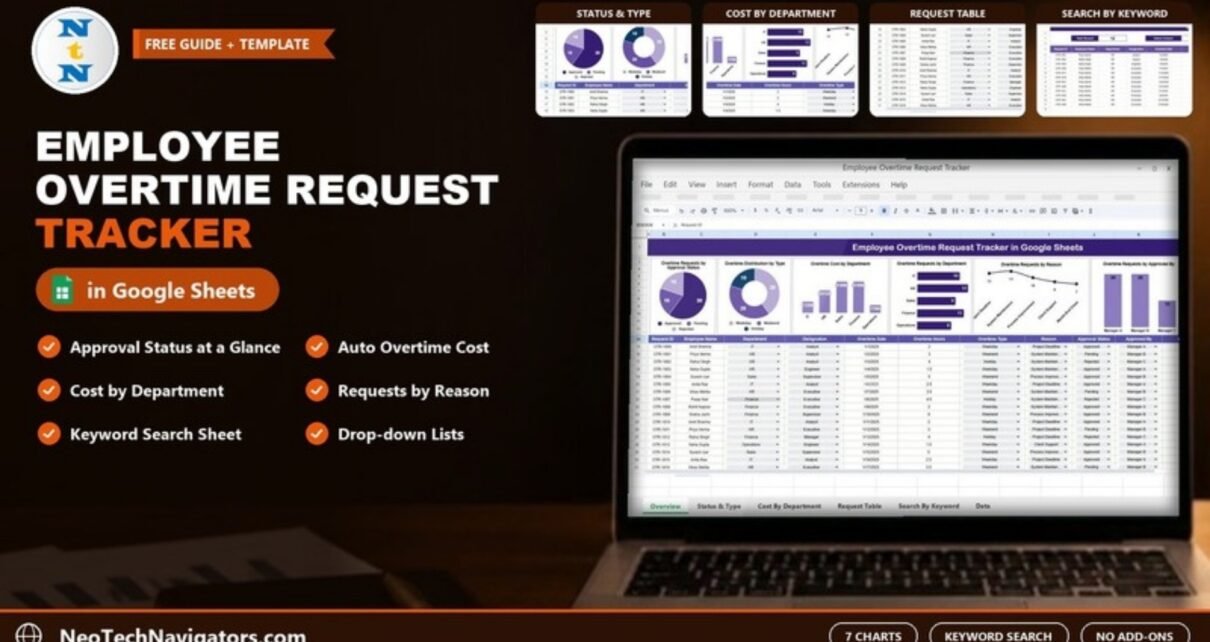
The Employee Overtime Request Tracker in Google Sheets gives HR, payroll and operations teams one place to log overtime requests, see which ones are approved, pending or rejected, and understand what overtime is costing each department. Instead of chasing requests across emails and chat messages, every request sits in one table and seven charts update from it.
It is meant for HR coordinators, payroll staff, department managers and small business owners who approve overtime and need a clean record for payroll. The file has two parts: a tracker sheet with charts and a data table, and a Search by Search Keyword and Field Name sheet that pulls matching records with a total count.
🎥 Watch the Video Tutorial
Get the Employee Overtime Request Tracker
Why Track Overtime Requests in One Sheet?
Overtime is often approved informally: a message to a manager, a quick yes, and the hours show up later on a timesheet. That works until payroll needs the numbers, a department goes over budget, or an employee asks why a request was rejected. Without a single record, nobody can answer those questions quickly.
A shared tracker fixes three common problems:
- Approval backlog – you can see at a glance how many requests are still Pending.
- Cost surprises – overtime cost is calculated on every row, so department totals are always current.
- Missing audit trail – each request records who approved it and why the overtime was needed.
The Tracker Sheet: Data Table Columns
Each overtime request is one row in the tracker table. The columns in the template are:
| Column | What you enter | Sample value |
|---|---|---|
| Request ID | Unique reference for the request | OTR-1000 |
| Employee Name | Who is requesting overtime | Amit Sharma |
| Department | Drop-down: IT, HR, Sales, Finance, Operations | IT |
| Designation | Drop-down: Analyst, Engineer, Supervisor, Executive, Manager | Analyst |
| Overtime Date | Date the overtime is worked | 1/1/2025 |
| Overtime Hours | Hours requested | 2 |
| Overtime Type | Drop-down, for example Weekday, Weekend or Holiday | Weekday |
| Reason | Drop-down: Project Deadline, System Maintenance, Process Improvement, Client Support, Month-End Close | Project Deadline |
| Approval Status | Drop-down: Approved, Pending, Rejected | Approved |
| Approved By | Drop-down: Manager A, Manager B, Manager C | Manager A |
| Hourly Rate | Overtime rate per hour | 500 |
| Overtime Cost | Calculated from hours and rate | 1,000 |
| Remarks | Optional notes | – |
Overtime Cost is simply hours multiplied by the hourly rate. If Overtime Hours is in column G and Hourly Rate in column L, the row formula looks like this:
=G15*L15You can check it against the sample: 3 hours at a rate of 600 gives 1,800, and 1.5 hours at 550 gives 825. The drop-down lists keep department, type, reason and status values consistent, which is what makes the charts accurate.
The Seven Charts Above the Table
The top of the tracker sheet holds seven charts that refresh whenever rows are added or edited. The sample file contains 50 requests.
- Overtime Requests by Approval Status – pie chart. Sample: 30 Approved, 10 Pending, 10 Rejected.
- Overtime Distribution by Type – donut chart. Sample: 20 Weekday, 20 Weekend, 10 Holiday.
- Overtime Cost by Department – column chart. Sample: Finance 31,950, Sales 31,850, HR 23,125, IT 11,250, Operations 7,700.
- Overtime Requests by Department – bar chart. Sample: HR 12, Finance 11, IT 10, Sales 9, Operations 8.
- Overtime Requests by Reason – line chart. Sample: System Maintenance 13, Project Deadline 12, Process Improvement 10, Client Support 8, Month-End Close 7.
- Overtime Requests by Approved By – column chart. Sample: Manager A 20, Manager B 20, Manager C 10.
- Overtime Requests by Designation – shows how requests spread across job roles.
Notice that HR raises the most requests (12) but Finance and Sales carry the highest cost. That kind of gap, between request volume and cost, is exactly what the tracker is designed to surface.

Search by Search Keyword and Field Name
The second sheet is a search screen. You pick a column in Select Column, type a value in Search Keyword, and the sheet lists every matching request with the same columns as the tracker. A Total Record box shows how many rows matched.
In the screenshot below, Select Column is set to Department and the keyword is hr, which returns 12 records, all HR requests, with their hours, type, status, approver, hourly rate and overtime cost. This is handy when an employee asks about a request, when payroll needs one department’s overtime for a period, or when an auditor wants every Rejected request.

If you want to build a similar search yourself, Google Sheets’ FILTER function combined with SEARCH is the usual approach, for example:
=FILTER(A2:M, ISNUMBER(SEARCH("hr", C2:C)))This is a general illustration of the technique, not the exact formula used inside the template.
How to Use the Tracker With Your Own Data
- Make a copy. Use File > Make a copy to save your own editable version to Google Drive.
- Set your lists. Update the drop-down options for departments, designations, reasons and approvers to match your organisation (Data > Data validation).
- Clear the sample rows. Delete the sample requests but keep the header row and the Overtime Cost formula column.
- Log each request. Enter a new Request ID, employee, date, hours, type, reason and hourly rate as requests arrive. Leave Approval Status as Pending.
- Record the decision. When a manager decides, change the status to Approved or Rejected and select the approver.
- Review the charts weekly. Check pending volume and cost by department before the payroll cut-off.
- Use the search sheet to pull one employee, department or status when you need a list for payroll or an audit.
Three Real-World Use Cases
Payroll month-end
Before running payroll, the payroll officer filters Approval Status to Approved on the search sheet and copies the hours and cost per employee into the payroll file. Pending requests are chased up before the cut-off.
Department budget review
A finance manager uses the Overtime Cost by Department chart in the monthly review. When one department’s cost keeps rising, the reason chart shows whether it is driven by deadlines, maintenance or month-end work.
Workload planning
An operations head notices that System Maintenance is the most common reason. That points to scheduling maintenance in normal hours or adding cover, rather than paying recurring overtime.
Best Practices
- Log requests before the overtime is worked, so approval happens first.
- Keep reasons specific and use the drop-downs instead of free text.
- Update the hourly rate whenever pay rates change, so costs stay correct.
- Give edit access only to HR and approvers; share a view-only copy with others.
- Review rejected requests periodically to spot unclear overtime rules.
Limitations and Who Should Not Use It
This is a spreadsheet tracker, so approvals are recorded by changing a cell, not through an automated workflow with email notifications. It does not pull hours from a time clock or calculate statutory overtime multipliers for you; enter the rate you actually pay. Large organisations that need role-based approvals, mobile requests and payroll integration should use HR software. For small and mid-sized teams that want clarity without new software, it fits well.
Related Guides and Templates
If you need to work out the rate itself, read how to calculate overtime pay in Google Sheets and how to calculate employee overtime in Google Sheets. To track the hours behind each request, the Attendance Tracker in Google Sheets pairs well with this file, and the Payroll Management Dashboard in Google Sheets helps once the overtime reaches payroll.
Related templates on NextGenTemplates: the Overtime Request Form Template in MS Word and Google Docs and the Attendance and Overtime Dashboard in Excel.
If you want to learn the FILTER, SEARCH and lookup formulas behind trackers like this, the Excel AI Mastery: 100 Formulas course on NextGenTemplates Academy covers them with practical lessons.
Frequently Asked Questions
How is overtime cost calculated in the tracker?
Overtime Cost equals Overtime Hours multiplied by the Hourly Rate on the same row. For example, 3 hours at 600 per hour gives 1,800.
Which approval statuses does it use?
Approved, Pending and Rejected. The Overtime Requests by Approval Status chart counts each one.
Can I add my own departments and reasons?
Yes. Edit the drop-down lists through Data > Data validation, and the charts will include the new values once rows use them.
How does the search sheet work?
Choose a column in Select Column, type a keyword, and the sheet lists every matching request with a Total Record count. In the sample, Department plus “hr” returns 12 records.
Does it apply overtime multipliers like 1.5x automatically?
No. The tracker multiplies hours by the hourly rate you enter. If you pay a premium rate, enter the premium rate in the Hourly Rate column.
Can managers approve requests from their phone?
They can open the sheet in the Google Sheets mobile app and change the status, but there is no separate approval form or notification built in.
Wrapping Up
The Employee Overtime Request Tracker in Google Sheets keeps every request, decision and cost in one table, with seven charts and a search sheet on top. Load your departments and approvers, start logging this month’s requests, and use the cost and status charts in your next payroll review.
Get the Overtime Request Tracker
📅 Last updated: October 2026