Cash flow represents the lifeblood of any business. Even profitable organizations can face serious challenges if cash inflow and outflow remain unbalanced. However, many teams still track cash movements using raw spreadsheets that fail to provide real-time insights.
That is exactly why a Cash Flow Dashboard in Google Sheets becomes an essential financial management tool.
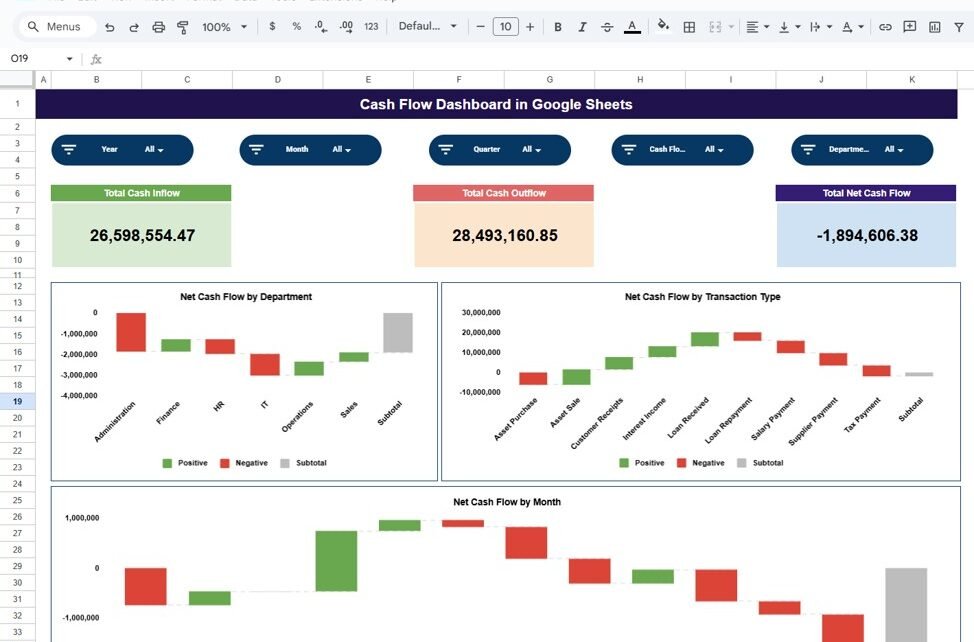
This ready-to-use dashboard helps finance teams, business owners, and managers track cash inflows, cash outflows, and net cash flow using a clear and visual Google Sheets dashboard. It converts transaction-level data into meaningful insights that support better financial decisions.
In this article, we explain how the dashboard works, its structure, charts, advantages, best practices, and FAQs.
What Is a Cash Flow Dashboard in Google Sheets?
Click to Buy Cash Flow Dashboard in Google Sheets
A Cash Flow Dashboard is a centralized financial reporting tool that monitors how cash moves in and out of the business. Instead of reviewing long transaction tables, users see summarized cash performance through cards and charts.
Because this dashboard is built in Google Sheets, it provides:
-
Real-time cash flow visibility
-
Easy collaboration with finance teams
-
Automatic chart updates
-
Cloud-based access
-
No expensive accounting software
This dashboard suits business owners, finance managers, accountants, and department heads.
Key Features of the Cash Flow Dashboard
This dashboard is ready to use and includes a Dashboard sheet and a Data input sheet, making it simple to maintain and analyze.
Dashboard Sheet Tab – Financial Overview
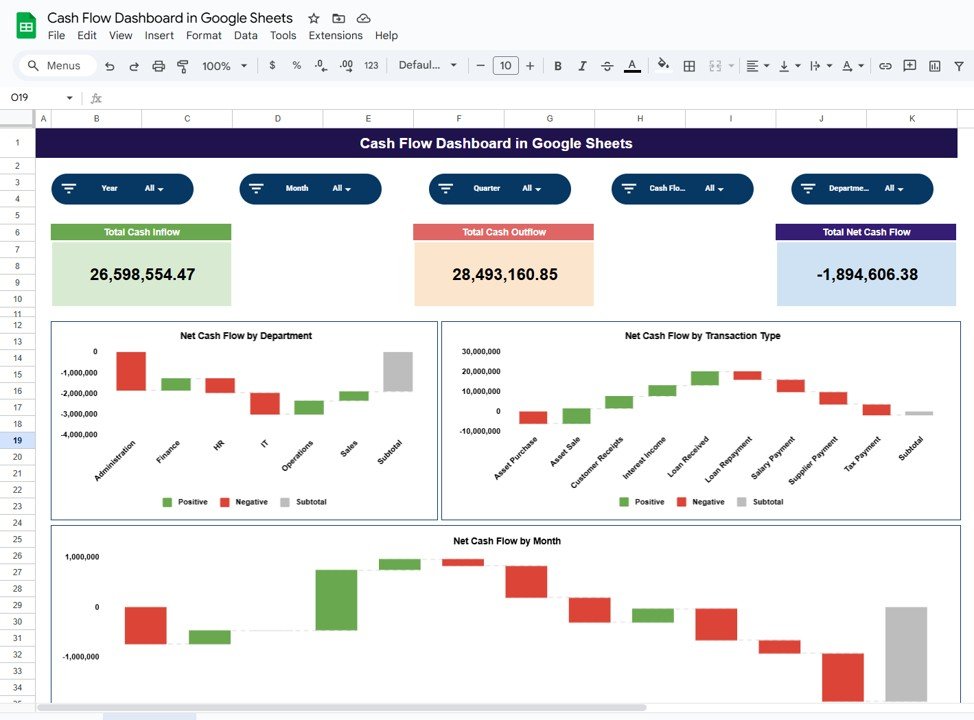
The Dashboard Sheet provides a high-level snapshot of cash flow performance using KPI cards and charts.
KPI Cards on the Dashboard
Total Cash Inflow
Shows the total amount of cash received during the selected period.
Total Cash Outflow
Displays the total cash spent during the selected period.
Total Net Cash Flow
Calculates the difference between cash inflow and cash outflow.
These cards help users instantly understand financial health.
Charts in the Cash Flow Dashboard
Click to Buy Cash Flow Dashboard in Google Sheets
The dashboard includes three insightful charts that show how cash moves across the organization.
Net Cash Flow by Department
This chart displays net cash flow contribution by each department.
It helps management:
-
Identify departments generating positive cash flow
-
Detect departments causing cash drain
-
Improve budget allocation
Net Cash Flow by Transaction Type
This chart categorizes net cash flow by transaction type such as:
-
Sales
-
Purchases
-
Salaries
-
Operating expenses
It helps finance teams understand cash flow drivers clearly.
Net Cash Flow by Month
This chart shows month-wise net cash flow trends.
It helps organizations:
-
Track seasonal cash patterns
-
Identify low-cash periods
-
Improve cash planning and forecasting
Click to Buy Cash Flow Dashboard in Google Sheets
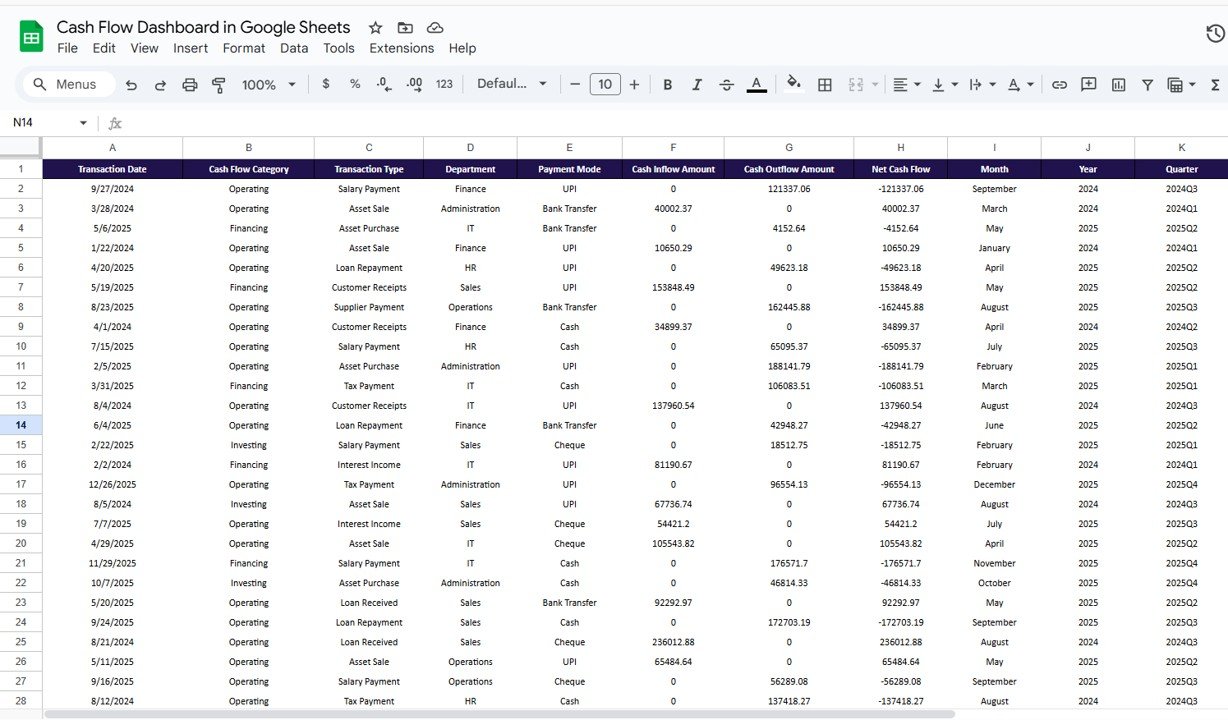
Data Input Sheet Tab
The Data Sheet serves as the backbone of the dashboard.
Typical columns include:
-
Transaction Date
-
Department
-
Transaction Type
-
Cash Inflow Amount
-
Cash Outflow Amount
-
Remarks
Once data is entered or updated, all dashboard cards and charts refresh automatically.
Click to Buy Cash Flow Dashboard in Google Sheets
Why Organizations Need a Cash Flow Dashboard
Without a cash flow dashboard, businesses struggle to maintain liquidity visibility. This dashboard helps organizations:
-
Monitor real-time cash position
-
Control spending effectively
-
Improve financial planning
-
Avoid cash shortages
-
Support strategic decision-making
A centralized dashboard brings clarity and confidence.
Advantages of the Cash Flow Dashboard
-
Centralized cash flow tracking
-
Clear inflow vs outflow visibility
-
Department-wise cash performance
-
Monthly trend analysis
-
Easy collaboration in Google Sheets
-
Cost-effective financial solution
Opportunities for Improvement
Click to Buy Cash Flow Dashboard in Google Sheets
You can enhance this dashboard further by adding:
-
Opening and closing cash balance tracking
-
Forecasted cash flow projections
-
Budget vs actual cash comparison
-
Bank account-wise cash flow analysis
-
Automated data import from accounting tools
These improvements provide deeper financial insights.
Best Practices for Using the Cash Flow Dashboard
-
Update transaction data regularly
-
Classify transaction types consistently
-
Review net cash flow weekly
-
Monitor negative cash trends early
-
Share insights with department heads
-
Secure access to financial data
Conclusion
Click to Buy Cash Flow Dashboard in Google Sheets
A Cash Flow Dashboard in Google Sheets provides a simple yet powerful way to monitor cash movement across the business. It replaces manual tracking with clear visuals, improves financial control, and supports proactive decision-making. Because the dashboard is ready to use and cloud-based, teams can start tracking cash flow immediately without technical complexity.
For organizations focused on financial stability and growth, this dashboard becomes an essential financial management tool.
Frequently Asked Questions (FAQs)
Click to Buy Cash Flow Dashboard in Google Sheets
1. Who should use this dashboard?
Business owners, finance managers, accountants, and leadership teams.
2. Can it track multiple departments?
Yes, it supports department-wise analysis.
3. Is the dashboard customizable?
Yes, cards, charts, and fields can be modified.
4. Can it support cash planning?
Yes, it highlights trends and cash gaps.
5. Is Google Sheets secure for financial data?
Yes, with proper access controls.
6. Does it require technical skills?
No, basic Google Sheets knowledge is enough.
Visit our YouTube channel to learn step-by-step video tutorials
Youtube.com/@NeotechNavigators
Watch the step-by-step video tutorial: