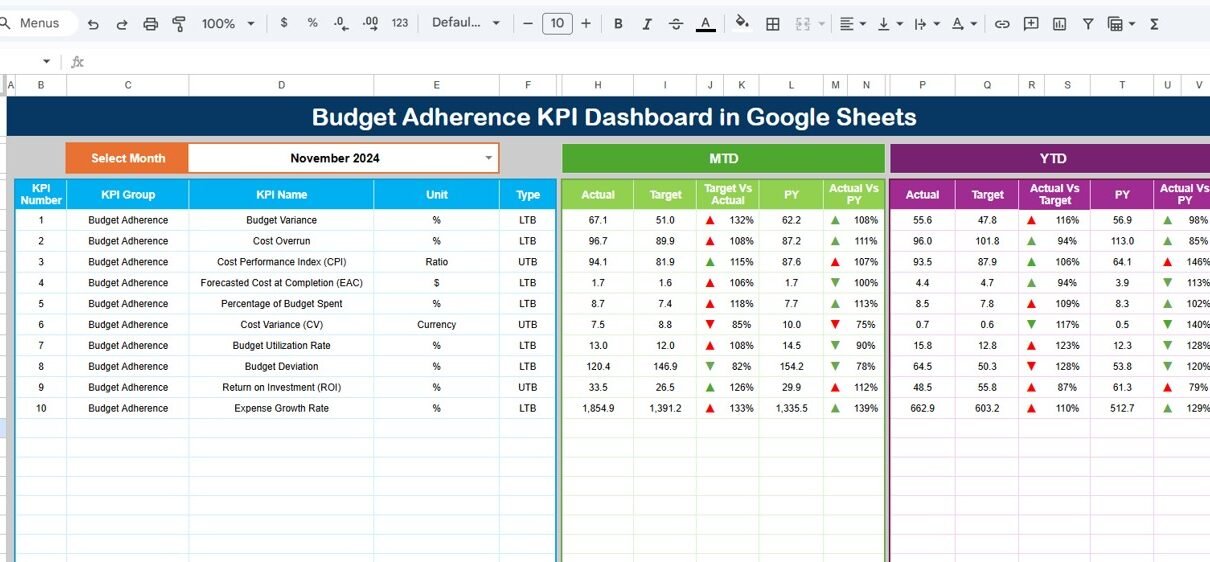
Every business wants to control its spending, reduce financial surprises, and stay aligned with planned budgets. However, most companies still track monthly spending manually in spreadsheets, emails, or scattered documents. Because of this, financial teams lose clarity, overspend unintentionally, and fail to monitor budget deviations on time. A Budget Adherence KPI Dashboard in Google Sheets […]
KPI Dashboard
Google-Sheet-KPI-Dashboard
Cash Flow KPI Dashboard in Google Sheets
Cash flow drives every business. When your cash inflow stays smooth and predictable, you can plan growth, invest confidently, and avoid financial stress. However, many organizations still track cash flow manually in scattered spreadsheets. As a result, they miss early warning signs and cannot measure performance accurately. A Cash Flow KPI Dashboard in Google Sheets […]
Revenue Growth KPI Dashboard in Google Sheets
Every business wants to grow consistently, improve revenue quality, and understand what drives performance. Because markets shift fast and customer behavior changes often, leaders need real-time insights that support quick and confident decisions. A Revenue Growth KPI Dashboard in Google Sheets does exactly that. It turns raw financial numbers into simple visuals, clear comparisons, and […]
SaaS Renewal KPI Dashboard in Google Sheets
Customer renewals drive long-term revenue in any SaaS business. However, many companies still track renewals using scattered spreadsheets and manual reports. As a result, renewal risks, churn signals, and revenue leakage often go unnoticed. That is why a SaaS Renewal KPI Dashboard in Google Sheets becomes a critical tool for subscription-based businesses. In this detailed […]
Onboarding Experience KPI Dashboard in Google Sheets
Delivering a smooth onboarding experience directly impacts customer satisfaction, product adoption, and long-term retention. However, without clearly defined KPIs and a structured dashboard, onboarding teams often struggle to measure performance accurately. That is exactly why an Onboarding Experience KPI Dashboard in Google Sheets becomes an essential performance management tool. In this detailed guide, you will […]
Cross-Selling KPI Dashboard in Google Sheets
Cross-selling plays a major role in increasing revenue without acquiring new customers. When businesses successfully cross-sell products or services to existing customers, they improve customer lifetime value and profit margins. However, many teams struggle to track cross-selling performance properly. They rely on raw sales reports that fail to show real insights. A Cross-Selling KPI Dashboard […]
Customer Feedback KPI Dashboard in Google Sheets
Customer feedback plays a vital role in business growth. Reviews, ratings, surveys, and comments help organizations understand customer expectations, service gaps, and improvement opportunities. However, when teams track feedback data using scattered files or raw survey results, insights remain unclear and decisions get delayed.Customer Feedback KPI Dashboard in Google Sheets A Customer Feedback KPI Dashboard […]
Digital Asset Management KPI Dashboard in Google Sheets
Digital assets such as images, videos, documents, design files, marketing creatives, brand resources, and multimedia content play a critical role in modern organizations. As digital content volume grows, teams often struggle to manage access, usage, updates, storage efficiency, and compliance. Because of this, organizations need structured performance tracking for digital asset management.Digital Asset Management KPI […]
Tech Support Efficiency KPI Dashboard in Google Sheets
Tech support teams directly impact customer satisfaction, system uptime, and business productivity. Every delayed response, unresolved ticket, or missed SLA affects both users and business operations. However, many organizations still track tech support performance using basic spreadsheets or scattered tools. As a result, teams lose visibility, efficiency drops, and service quality suffers.Tech Support Efficiency KPI […]
IT Operations KPI Dashboard in Google Sheets
IT operations teams maintain the stability, performance, and availability of business systems. However, when systems grow complex, teams struggle to track incidents, downtime, service quality, costs, and workloads. Because of limited visibility, issues escalate faster, response slows down, and service quality suffers. That is why organizations now rely on structured KPI dashboards. An IT Operations […]


