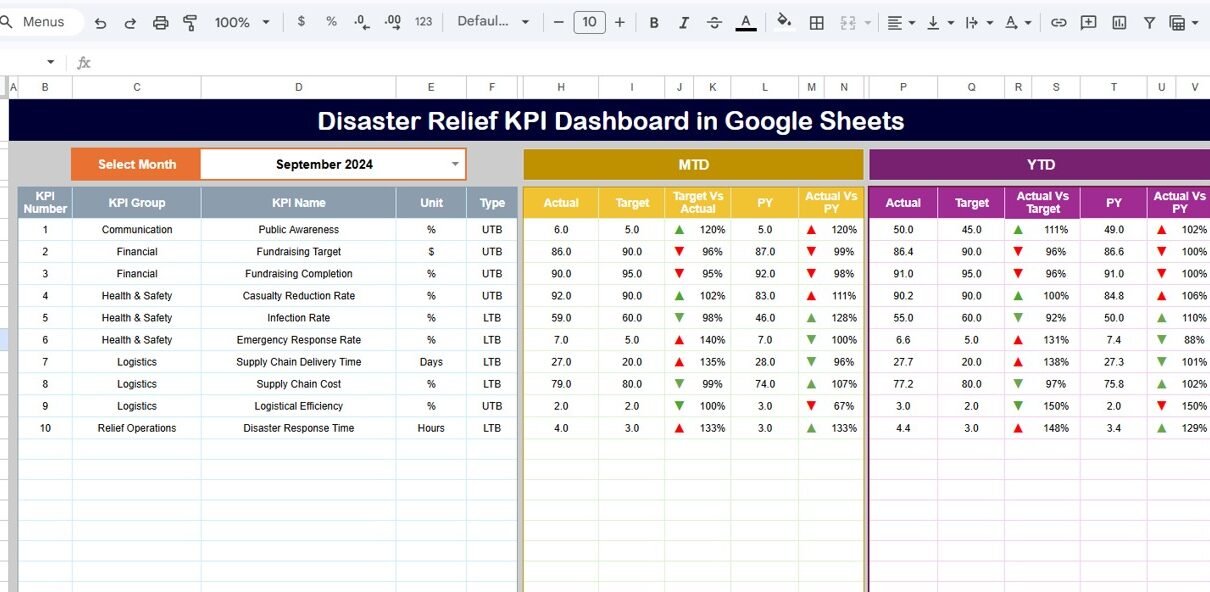
Track 12+ disaster relief KPIs across 6 interactive Google Sheets with MTD, YTD, Target, and Previous Year data. Features trend charts, conditional formatting arrows, and a month-selector dropdown. Setup in under 10 minutes.
Online Tutorial for Data Analysis and Automation
Google-Sheet-KPI-Dashboard
Track 12+ disaster relief KPIs across 6 interactive Google Sheets with MTD, YTD, Target, and Previous Year data. Features trend charts, conditional formatting arrows, and a month-selector dropdown. Setup in under 10 minutes.
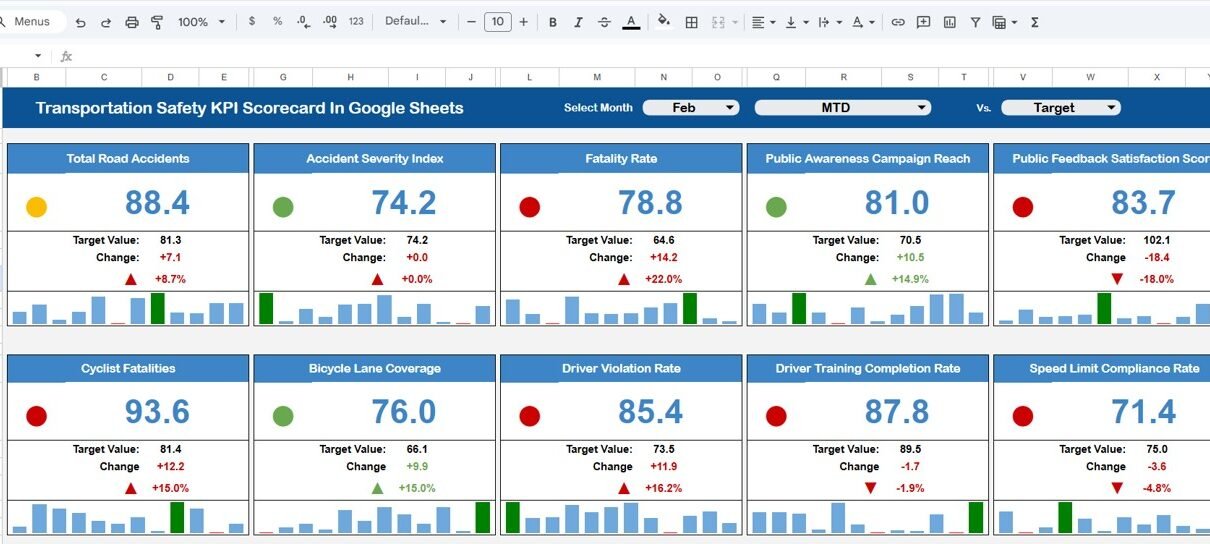
Track 10 transportation safety KPIs with automated MTD/YTD calculations, traffic light indicators, and trend analysis charts using this ready-to-use Google Sheets scorecard template.
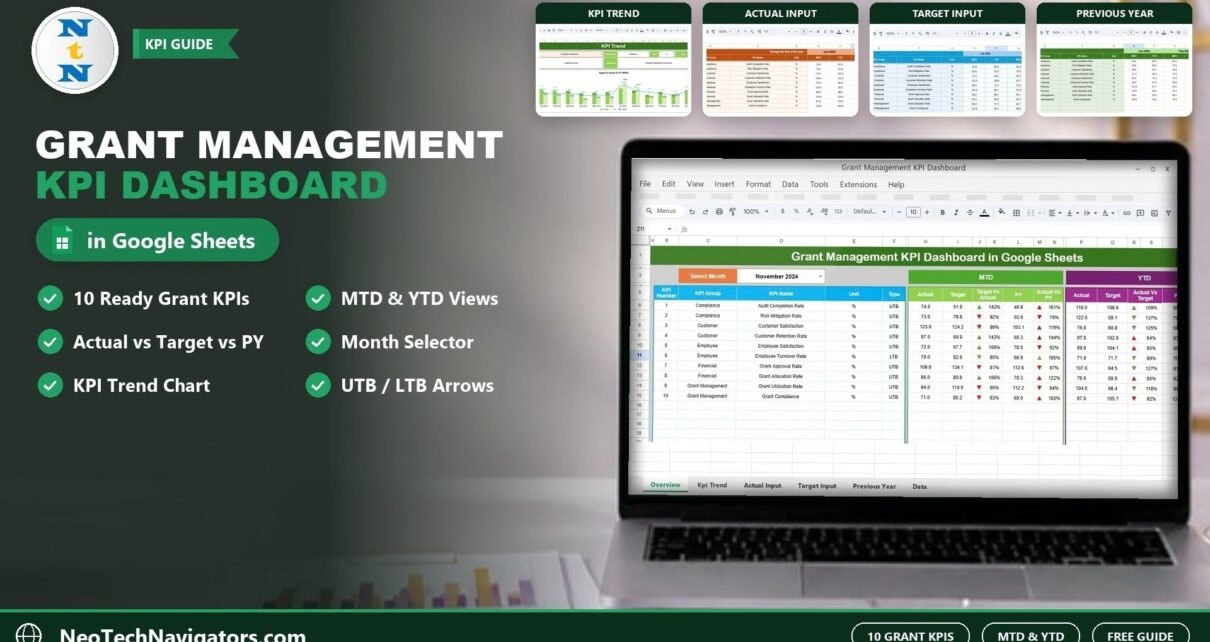
A Google Sheets KPI dashboard for grant teams: 10 ready KPIs across Compliance, Customer, Employee, Financial and Grant Management groups, with MTD/YTD Actual vs Target vs Previous Year, a KPI trend chart and a KPI Definition sheet.
Track 15+ municipal KPIs with MTD/YTD comparisons, trend charts, and color-coded indicators using the Municipal Services KPI Scorecard in Google Sheets. Ready-to-use template for city administrators and municipal planners.
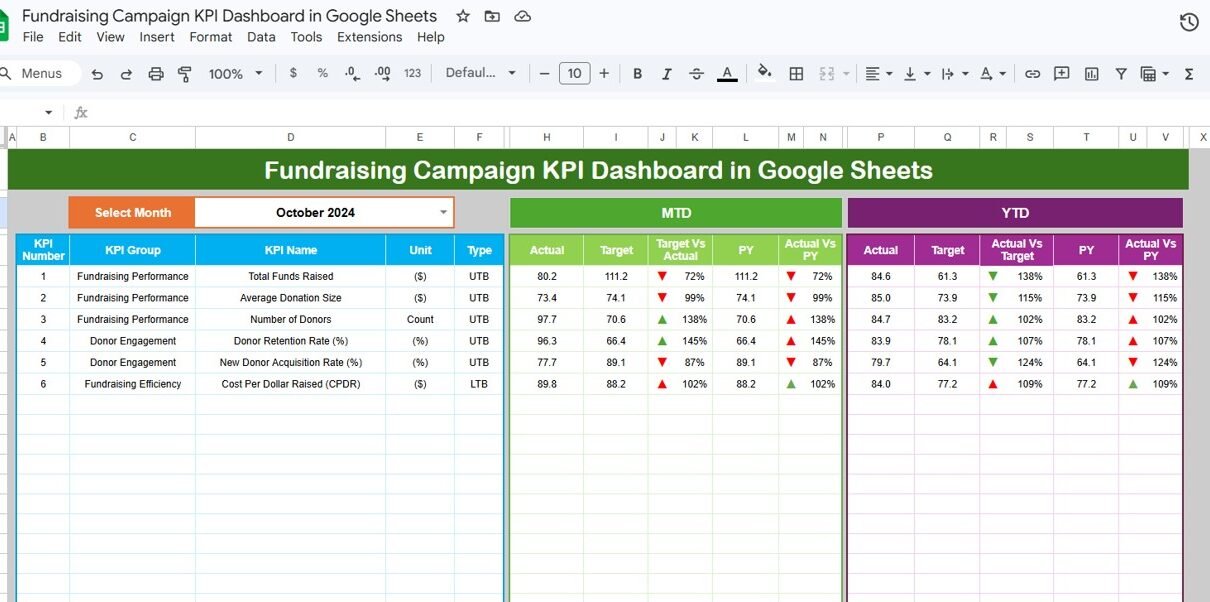
Track fundraising campaign KPIs across 6 worksheets with MTD/YTD comparisons, target tracking, prior-year analysis, trend charts, and conditional formatting in this ready-to-use Google Sheets KPI Dashboard template.
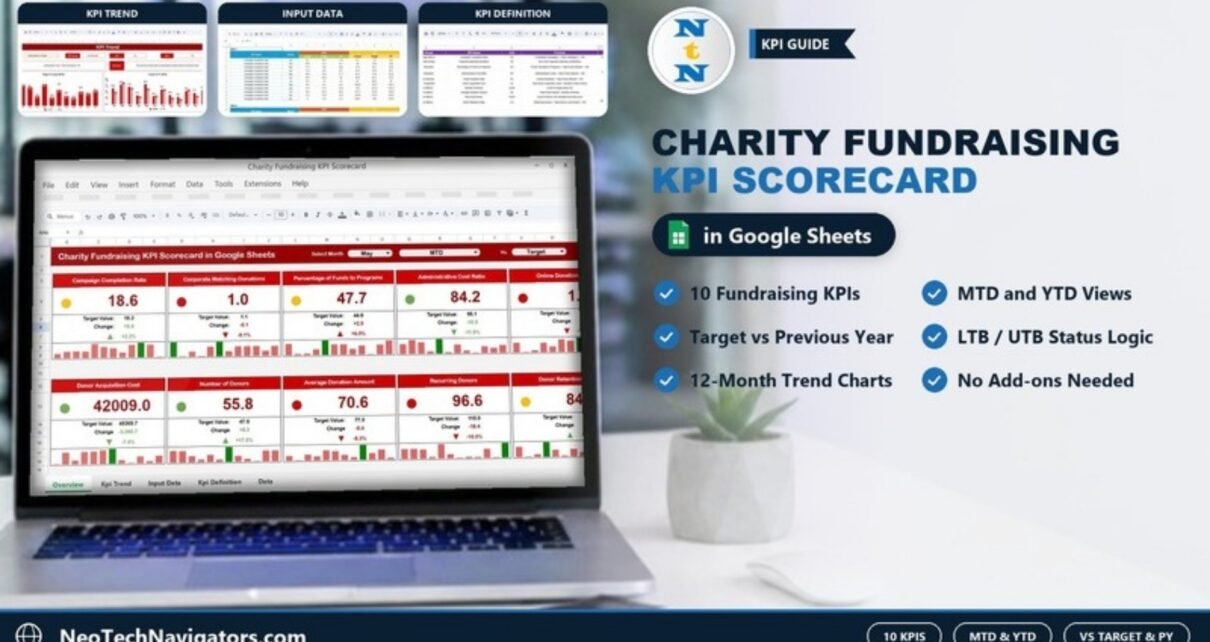
A Google Sheets scorecard that tracks 10 charity fundraising KPIs by month, MTD and YTD, against target or last year, with LTB/UTB status logic and 12-month trend charts.
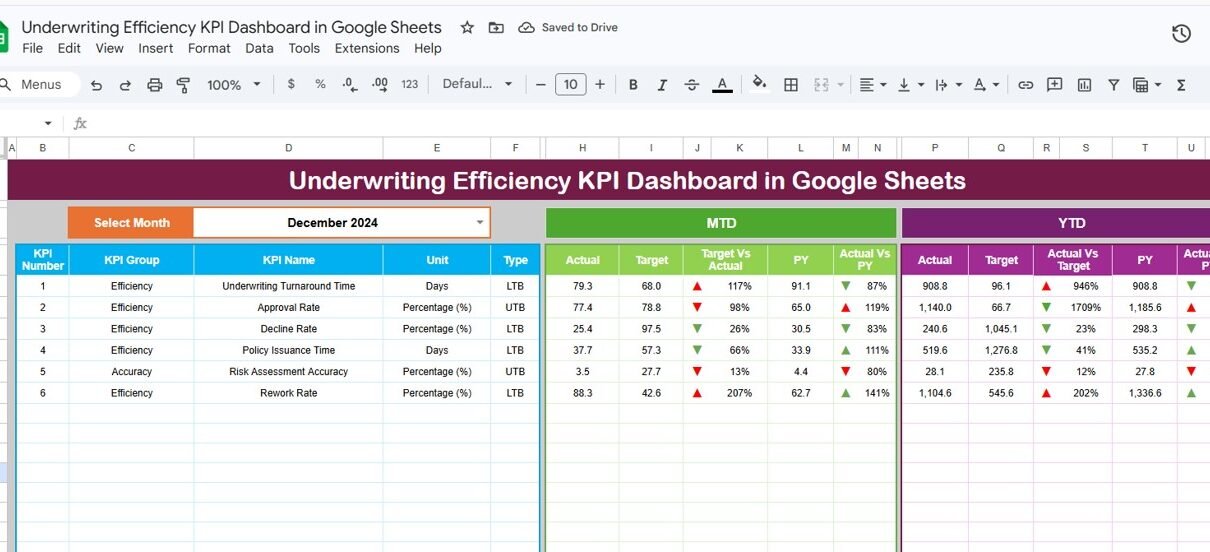
Track 15+ underwriting KPIs including loss ratio, combined ratio, and quote-to-bind ratio with MTD/YTD trends, conditional formatting arrows, and month-based filtering in this ready-to-use Google Sheets KPI Dashboard template.
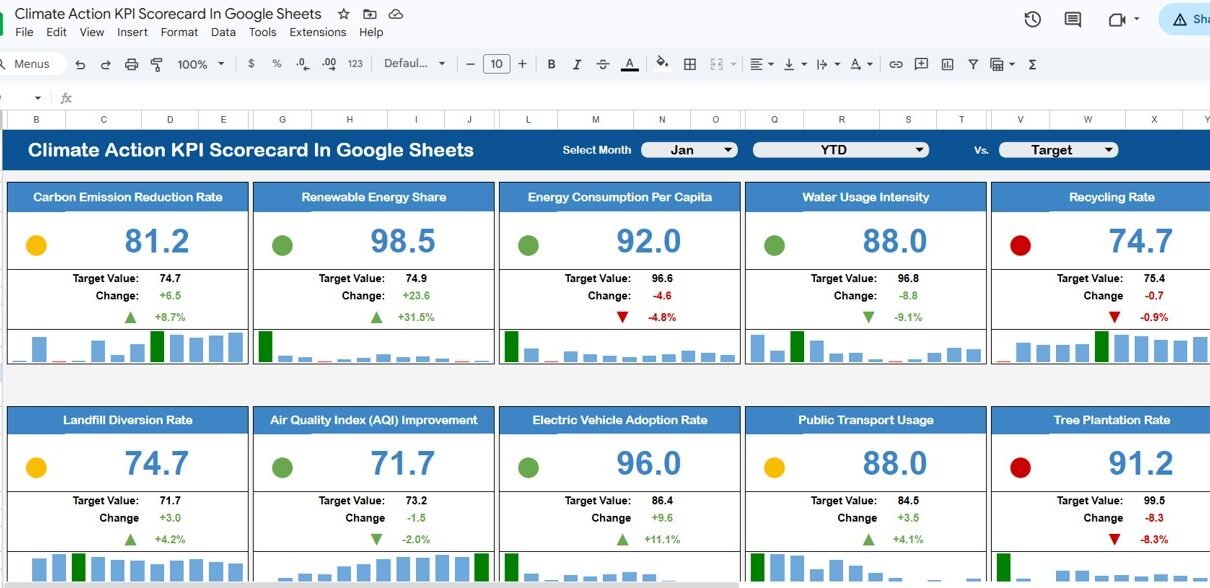
Track climate action KPIs with MTD/YTD comparison, conditional formatting arrows, trend charts, and LTB/UTB logic across 4 Google Sheets worksheets. Setup under 10 minutes.
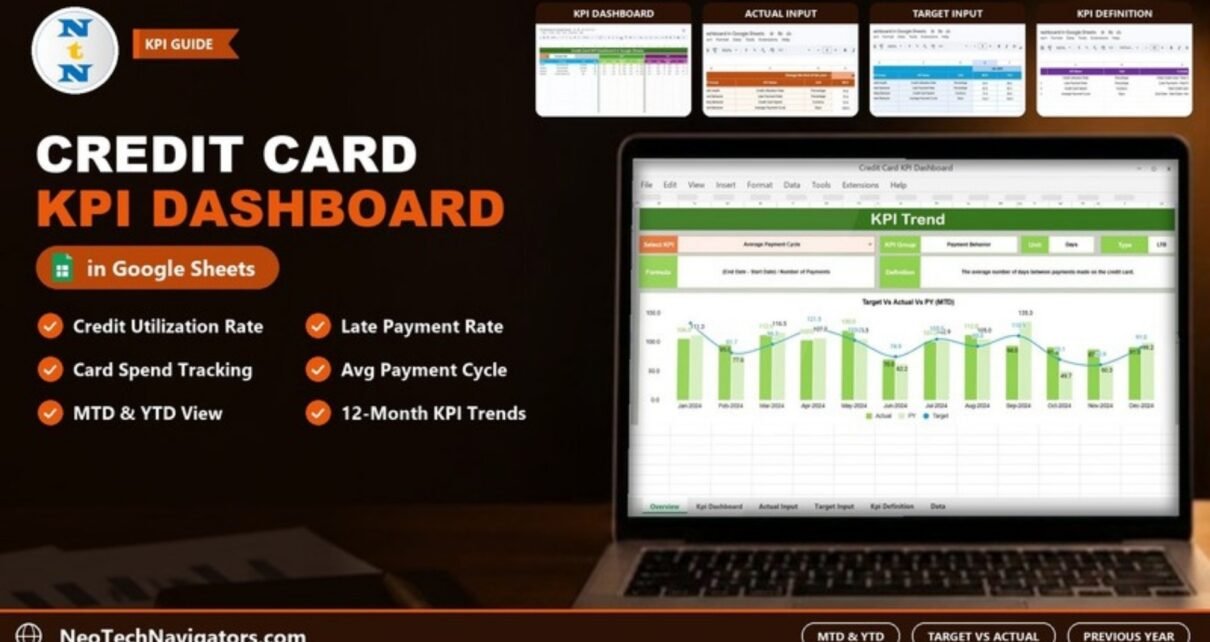
How the Credit Card KPI Dashboard in Google Sheets tracks Credit Utilization Rate, Late Payment Rate, Credit Card Spend and Average Payment Cycle against target and last year, MTD and YTD, across six sheets.
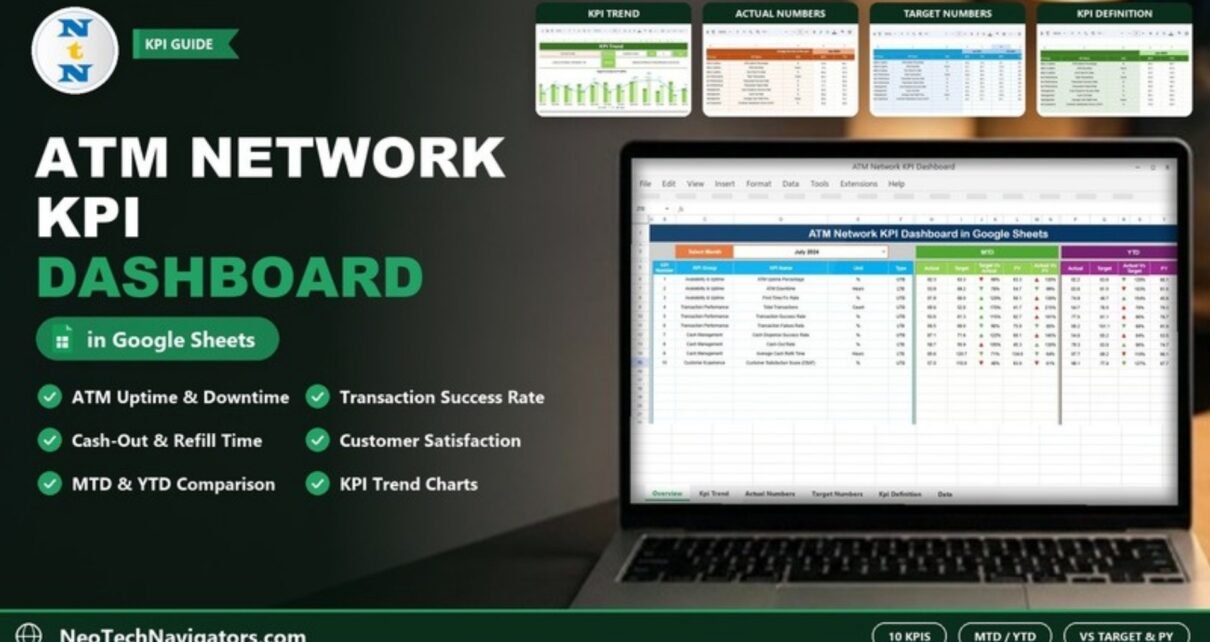
A Google Sheets ATM Network KPI Dashboard that compares uptime, transaction, cash management and CSAT KPIs against target and last year, month by month and year to date.