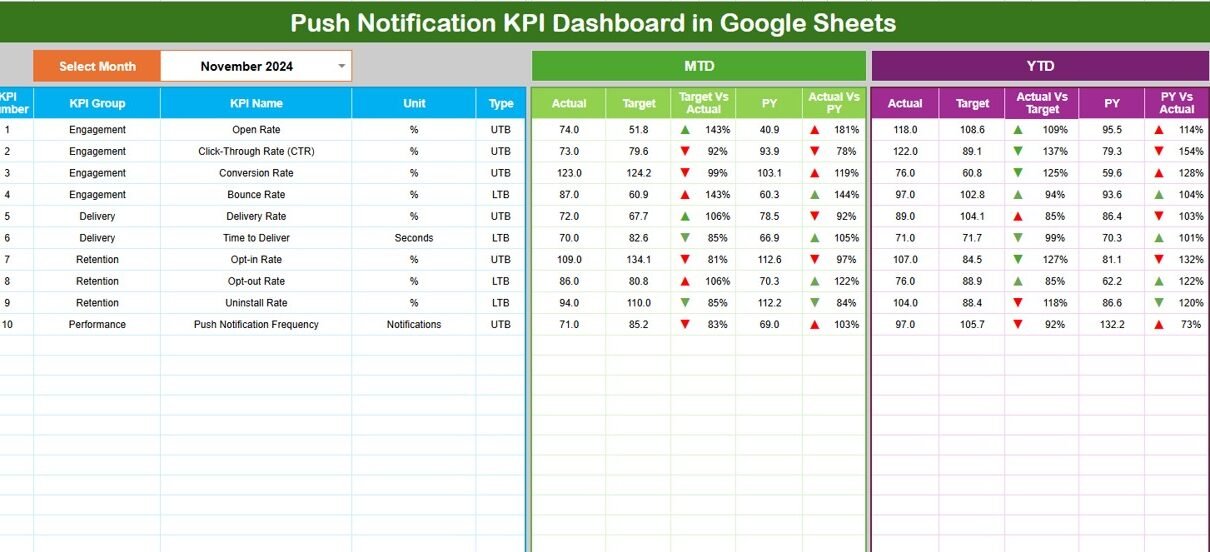
Push notifications play a critical role in user engagement, retention, and conversions. However, many marketing and product teams struggle to track push notification performance effectively. Data often sits across tools, dashboards remain static, and performance insights become delayed. That is exactly why a Push Notification KPI Dashboard in Google Sheets becomes an essential solution. This […]
KPI Dashboard
Google-Sheet-KPI-Dashboard
Retail Foot Traffic KPI Dashboard in Google Sheets
Retail success depends heavily on understanding how many customers walk into your store, when they visit, and how their behavior changes over time. However, many retail teams still rely on raw footfall counters or basic spreadsheets, which makes trend analysis slow and inaccurate.Retail Foot Traffic KPI Dashboard in Google Sheets This is exactly where a […]
Ticket Resolution Time KPI Dashboard in Google Sheets
Ticket resolution time directly impacts customer satisfaction, operational efficiency, and service quality. Whether you manage IT support tickets, customer service requests, or internal helpdesk issues, delayed ticket resolution leads to frustration, SLA breaches, and increased costs. However, many teams still track ticket performance across emails or scattered spreadsheets, which makes monitoring slow and inaccurate.Ticket Resolution […]
Customer Complaint Resolution KPI Dashboard in Google Sheets
Customer complaints directly impact brand reputation, customer loyalty, and revenue. When organizations fail to track complaints properly, resolution delays increase and customer satisfaction drops. Many teams still rely on emails, ticket logs, or disconnected spreadsheets, which makes complaint tracking inconsistent and reactive.Customer Complaint Resolution KPI Dashboard in Google Sheets This challenge makes a Customer Complaint […]
Cultural Diversity KPI Dashboard in Google Sheets
Cultural diversity has become a critical success factor for modern organizations. Diverse teams bring better ideas, stronger collaboration, and improved business performance. However, organizations cannot improve diversity unless they measure it clearly and consistently. When diversity data remains scattered across HR systems or static reports, decision-making becomes slow and ineffective.Cultural Diversity KPI Dashboard in Google […]
ESG (Environmental, Social, and Governance) KPI Dashboard in Google Sheets
Organizations across the world now focus heavily on sustainability, social responsibility, and ethical governance. Investors, regulators, customers, and employees expect companies to measure and report ESG performance transparently. However, ESG data often remains scattered across departments, spreadsheets, and reports, which makes tracking and analysis difficult. This challenge makes an ESG (Environmental, Social, and Governance) KPI […]
Mobile App Engagement KPI Dashboard in Google Sheets
Mobile apps succeed or fail based on user engagement. Downloads alone never define success. Instead, organizations must understand how users interact with the app, how often they return, how long they stay, and what actions they perform. Because engagement data often lives across multiple analytics tools, teams struggle to see a complete picture.Mobile App Engagement […]
Seasonal Sales KPI Dashboard in Google Sheets
Seasonal sales strongly influence revenue, inventory planning, marketing campaigns, and staffing decisions. During peak seasons, even small mistakes can lead to stock shortages or lost revenue. Meanwhile, during low seasons, poor planning can increase costs and reduce margins. Therefore, businesses must track seasonal sales performance accurately and consistently. That is exactly why a Seasonal Sales […]
Technical Support KPI Dashboard in Google Sheets
Technical support teams play a critical role in customer satisfaction and business continuity. Every ticket, response, and resolution directly impacts user experience. However, when support data remains scattered across tools or static reports, teams struggle to measure performance and improve service quality. That is exactly why a Technical Support KPI Dashboard in Google Sheets becomes […]
Resource Allocation KPI Dashboard in Google Sheets
Resource allocation plays a critical role in project success, operational efficiency, and cost control. Teams, budgets, and time are limited resources. Therefore, organizations must allocate them wisely to avoid overutilization, idle capacity, and missed deadlines. However, when resource data sits in scattered spreadsheets or manual reports, decision-making becomes slow and inaccurate.Resource Allocation KPI Dashboard in […]


