Running a catering business successfully requires more than just great food and customer service. You must track performance, measure results, and make quick data-driven decisions. That’s where a Catering Business KPI Dashboard in Google Sheets becomes a game-changer.Catering Business KPI Dashboard in Google Sheets
This blog post explores everything about this powerful tool — what it is, why it matters, how it works, its key features, advantages, best practices, and frequently asked questions.Catering Business KPI Dashboard in Google Sheets.
Click to buy Catering Business KPI Dashboard in Google Sheets
What Is a Catering Business KPI Dashboard in Google Sheets?
A Catering Business KPI Dashboard is a dynamic and visual performance-tracking system built using Google Sheets. It helps catering managers, restaurant owners, and event coordinators monitor key performance indicators (KPIs) like sales, order volume, food cost, customer satisfaction, and staff productivity.
Unlike manual reporting, this dashboard automates calculations and visualizations, allowing business owners to see Month-to-Date (MTD) and Year-to-Date (YTD) results instantly.
Because it’s built in Google Sheets, the dashboard is:
- Easy to use and share across teams
- Cloud-based and accessible anytime, anywhere
- Fully customizable to your specific business KPIs
Why Use Google Sheets for a Catering Dashboard?
Google Sheets is one of the most flexible and accessible tools for business analytics. You don’t need expensive BI software or technical expertise — everything runs in a familiar spreadsheet environment.Catering Business KPI Dashboard in Google Sheets
Here’s why it’s ideal for catering businesses:
- Real-time collaboration: Multiple users can update and view data simultaneously.
- Automation through formulas: Built-in formulas auto-calculate KPIs, saving time.
- Custom visuals: Create colorful, easy-to-read charts and performance cards.
- Simple data input: Just fill in monthly numbers — the dashboard updates instantly.
- Accessibility: Works on any device with an internet connection.
Structure of the Catering Business KPI Dashboard in Google Sheets
This ready-to-use dashboard template includes six well-organized worksheets, each serving a distinct purpose. Let’s explore how they work together.
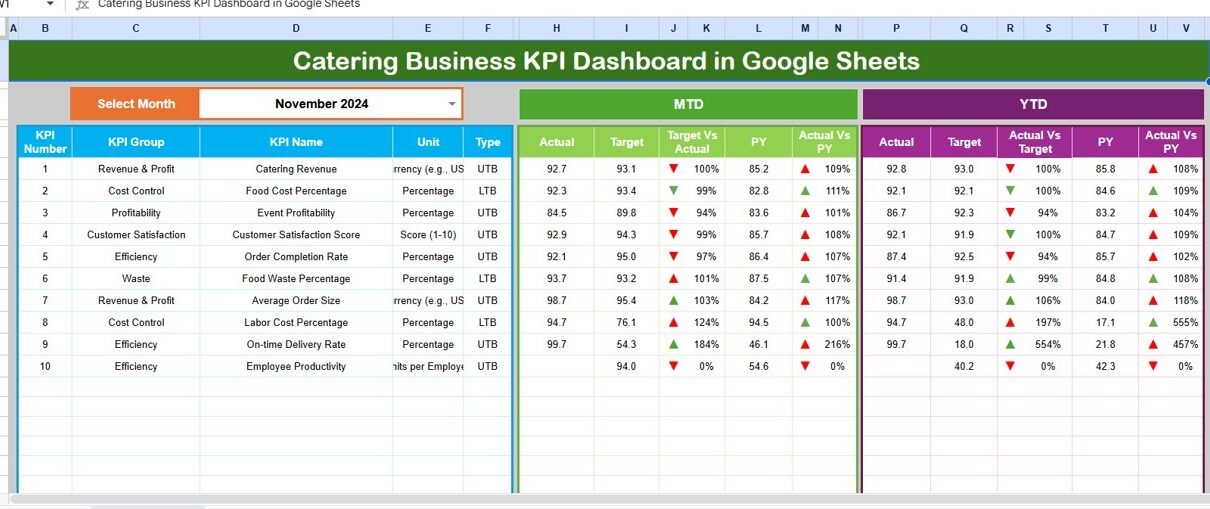
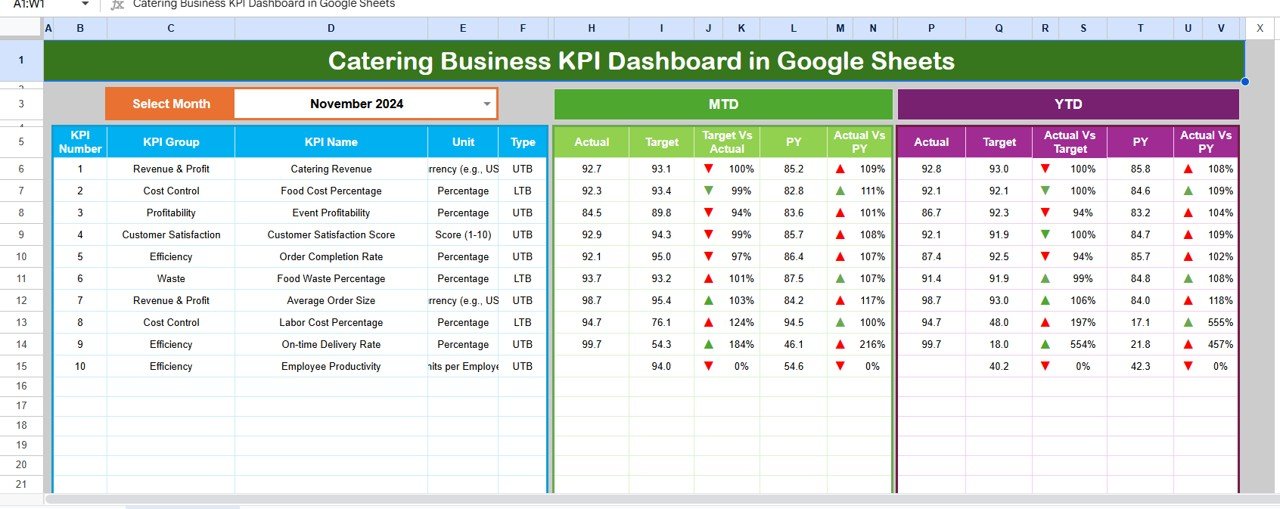
Dashboard Sheet Tab
This is the main control center of the dashboard.
On the top, you’ll find a Month selector (cell D3) — choose any month to see corresponding data. Once you pick the month, the dashboard automatically refreshes to display updated results for all KPIs.
Here, you’ll find:
- MTD Actual vs Target vs Previous Year: Compare current month’s results.
- YTD Actual vs Target vs Previous Year: Analyze yearly progress.
- Conditional formatting with arrows: Instantly spot performance trends — green for improvement, red for decline.
Click to buy Catering Business KPI Dashboard in Google Sheets
This sheet provides a complete visual summary of your catering operations in one glance.
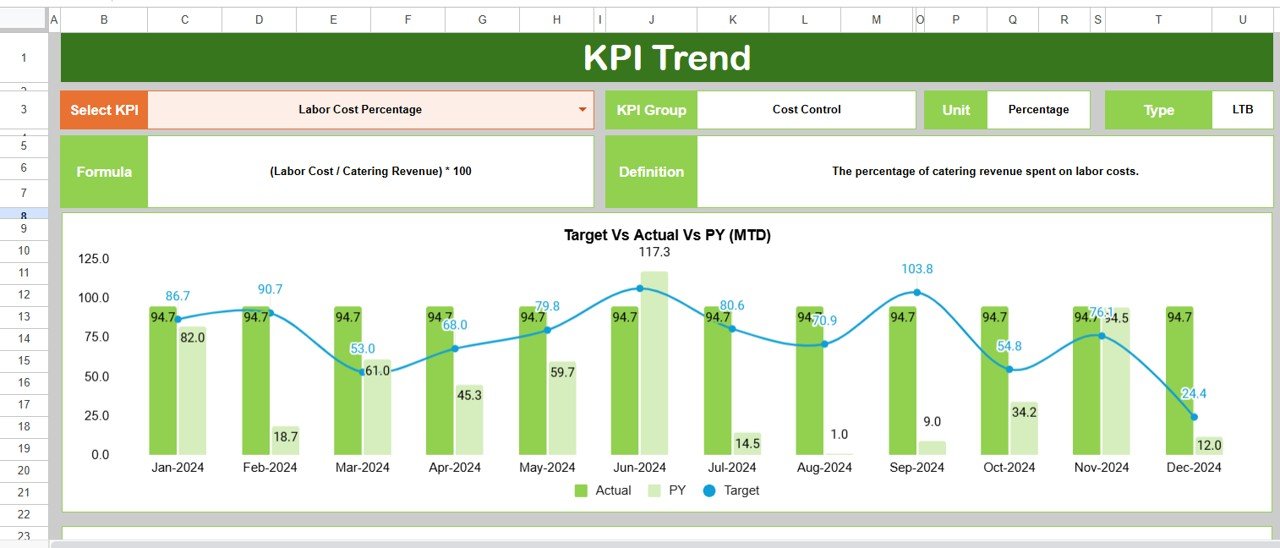
Trend Sheet Tab
This sheet allows deep-dive analysis into individual KPIs.
On cell C3, you can choose a KPI from the drop-down menu. Once selected, the dashboard automatically displays:
- KPI Group
- Unit of Measurement
- Type (UTB – Upper the Better or LTB – Lower the Better)
- KPI Formula and Definition
- MTD and YTD trend charts
You can visualize trends for Actual, Target, and Previous Year (PY) — perfect for identifying consistent growth or early warning signs.
Click to buy Catering Business KPI Dashboard in Google Sheets
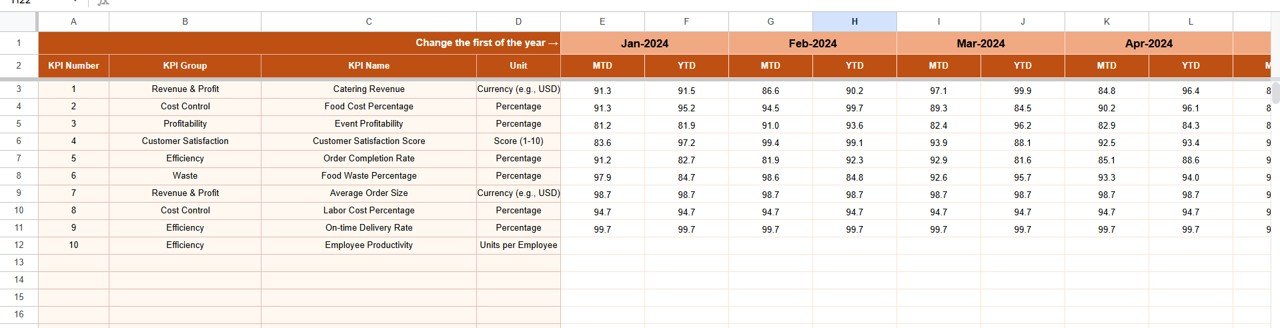
Actual Numbers Input Sheet
Here’s where you record real monthly performance data.
- Change the first month of the year in cell E1 — the entire dashboard updates accordingly.
- Enter the actual numbers for each KPI (MTD and YTD).
Example metrics:
- Monthly revenue from catering events
- Number of new clients
- Average order size
- Customer satisfaction score
- Staff hours worked
This data powers your visual dashboard automatically.
Click to buy Catering Business KPI Dashboard in Google Sheets
Target Sheet Tab
This sheet defines your business goals.
For each KPI, you’ll enter monthly targets — both MTD and YTD. This allows the dashboard to calculate variance and show how close your team is to achieving its objectives.
Setting clear targets helps managers focus on what matters most — improving profitability, efficiency, and customer experience.
Previous Year Number Sheet
Tracking performance against the previous year provides valuable context.
Enter last year’s data in this sheet. The dashboard then compares Actual vs PY performance, using conditional formatting to highlight positive or negative changes.Catering Business KPI Dashboard in Google Sheets
This feature helps you identify growth patterns and spot areas needing attention.
KPI Definition Sheet Tab
Transparency is essential for consistent reporting.
In this sheet, you’ll define each KPI clearly — including:
- KPI Name
- KPI Group (e.g., Operations, Financial, Customer, Staff)
- Unit of Measurement
- Formula
- KPI Definition
Having standardized definitions ensures that everyone — from managers to staff — interprets each KPI correctly.
How the Catering Dashboard Works
- Input Data: Enter monthly actuals, targets, and previous year figures.
- Auto-Calculation: Built-in formulas compute MTD and YTD summaries.
- Dynamic Visualization: Charts and arrows adjust based on your performance.
- KPI Comparison: Quickly compare Actual vs Target vs Previous Year.
- Actionable Insights: Identify strengths and areas needing improvement instantly.
The beauty of this system lies in automation — once you set it up, everything runs seamlessly month after month.
Advantages of Using the Catering Business KPI Dashboard
Let’s explore the key benefits this Google Sheets dashboard offers.Catering Business KPI Dashboard in Google Sheets
- Improved Decision-Making
Real-time performance tracking helps managers take quick, informed actions. You can instantly see which areas exceed expectations and which need adjustments.
- Time Efficiency
No more manual reporting or endless Excel formulas — automated summaries and charts save hours every month.
- Better Accountability
Each team or department can clearly see their KPIs, driving responsibility and ownership.
- Easy Customization
You can modify KPIs, formulas, and visuals as your catering business evolves — all within Google Sheets.
- Cost-Effective
Unlike paid analytics tools, Google Sheets is free and accessible to all employees.
- Team Collaboration
Everyone can work on the same dashboard simultaneously — perfect for remote or multi-location teams.
How to Use the Catering Business KPI Dashboard Effectively
Follow these steps to make the most out of your dashboard:
- Set Clear Targets: Define realistic MTD and YTD goals for each KPI.
- Update Data Monthly: Enter actual results regularly for accurate tracking.
- Review Trends Weekly: Use the Trend sheet to monitor deviations early.
- Share Reports: Discuss insights with your team to identify improvement actions.
- Customize Visuals: Modify charts or colors to match your brand identity.
- Integrate with Forms: Use Google Forms to collect live catering event data directly.
These simple steps transform your Google Sheet into a live performance engine.
Key Insights You Can Gain
The Catering Business KPI Dashboard isn’t just about numbers — it’s about insights. With consistent use, you’ll be able to answer critical questions like:Catering Business KPI Dashboard in Google Sheets
- Which catering services generate the highest profits?
- Are our food costs increasing faster than revenue?
- Which month has the best customer satisfaction scores?
- Are we improving staff efficiency over time?
- How close are we to achieving annual goals?
Each insight helps you refine strategy, optimize spending, and grow sustainably.
Best Practices for the Catering Business KPI Dashboard
To get maximum value from this dashboard, follow these best practices:
✅ Keep KPIs Simple and Actionable
Avoid tracking too many metrics. Focus on the ones that drive results, such as food cost, client satisfaction, and order volume.
Review Data Consistently
Consistency is key. Update data monthly and schedule periodic performance reviews.
Use Conditional Formatting Wisely
Color-coded arrows and bars make trends easy to spot — use them to highlight performance changes clearly.
Protect Data Integrity
Lock formula cells to prevent accidental edits. Use data validation for drop-downs to maintain accuracy.
Visualize for Impact
Add meaningful charts — such as revenue trends or order completion rates — to make data interpretation quick.
Foster a Data-Driven Culture
Encourage every department — from kitchen to delivery — to use data insights for improvement.
Who Can Benefit from This Dashboard?
This dashboard is perfect for:
- Catering business owners and managers
- Restaurant chains offering catering services
- Event management firms
- Wedding planners and corporate food service providers
- Small business entrepreneurs managing catering startups
Whether you run a small kitchen or a large-scale catering operation, this dashboard simplifies your performance tracking.
Conclusion
The Catering Business KPI Dashboard in Google Sheets is more than just a spreadsheet — it’s a complete performance management solution. It helps you track financial health, operational efficiency, and customer satisfaction with ease.
By combining automation, visualization, and collaboration, this tool ensures you stay ahead of business challenges and focus on what truly matters — delivering excellent service and delicious food.
Adopt this dashboard today to transform your catering operations into a data-driven success story.
Frequently Asked Questions (FAQs)
- What is a KPI in the catering business?
A KPI (Key Performance Indicator) measures specific performance aspects such as sales, food costs, client satisfaction, and staff efficiency. It helps evaluate business health.
- How can Google Sheets help catering managers?
Google Sheets enables live data tracking, easy sharing, and automatic chart generation without extra software costs.
- Can I add more KPIs to this dashboard?
Yes, you can easily add new KPIs in the KPI Definition and Actual Numbers Input sheets. The dashboard updates automatically.
- Is this dashboard suitable for large catering operations?
Absolutely! The design supports scalability, allowing you to manage hundreds of KPIs and events seamlessly.
- Do I need technical skills to use this dashboard?
No. The dashboard uses built-in formulas and dropdowns — anyone familiar with Google Sheets can operate it effortlessly.
- Can this template track profitability per event?
Yes, by adding KPIs like “Revenue per Event” and “Cost per Event,” you can measure profitability precisely.
- How often should I update the dashboard?
Ideally, update it monthly for accurate performance monitoring. However, you can also track weekly if needed.
- Is it possible to link this dashboard with Google Forms?
Yes. You can integrate Google Forms to collect catering order data directly, feeding results into your dashboard automatically.
- What makes this dashboard better than Excel versions?
The cloud-based structure, real-time collaboration, and accessibility make Google Sheets ideal for catering teams working across locations.
- Where can I get the ready-to-use Catering Business KPI Dashboard?
You can download the complete Catering Business KPI Dashboard in Google Sheets template from NextGenTemplates.com and start tracking your business KPIs instantly.
Visit our YouTube channel to learn step-by-step video tutorials
Watch the step-by-step video tutorial:
Click to buy Catering Business KPI Dashboard in Google Sheets