The chemical industry operates in a highly regulated, performance-driven, and efficiency-focused environment. Companies must continuously monitor production efficiency, safety performance, quality standards, operational costs, and environmental compliance. However, many chemical organizations still rely on manual spreadsheets and disconnected reports. As a result, managers struggle to evaluate performance quickly and accurately.
So, how can chemical companies monitor KPIs effectively while keeping reporting simple and accessible?
The answer is the Chemical KPI Scorecard in Google Sheets.
This article provides a complete guide to understanding, using, and implementing a Chemical KPI Scorecard. Moreover, you will learn its features, structure, advantages, best practices, and frequently asked questions.
What Is a Chemical KPI Scorecard in Google Sheets?
Click to Buy Chemical KPI Scorecard in Google Sheets
A Chemical KPI Scorecard in Google Sheets is a ready-to-use performance monitoring template designed to track key operational and business metrics using structured Key Performance Indicators (KPIs).
Instead of reviewing multiple reports manually, this scorecard consolidates KPI performance into a single dynamic dashboard. Consequently, managers can analyze monthly and yearly performance instantly.
The scorecard tracks 10 different KPIs to measure overall business performance.
Because the solution runs in Google Sheets, teams can collaborate in real time while maintaining centralized data control.
Why Do Chemical Companies Need KPI Scorecards?
Chemical operations involve complex workflows such as production planning, quality control, safety monitoring, and cost management. Therefore, organizations must monitor performance continuously.
Without KPI tracking:
- Performance gaps remain unnoticed
- Safety risks increase
- Operational costs rise
- Decision-making becomes slower
- Compliance monitoring becomes difficult
However, a KPI scorecard simplifies performance tracking through automation and visualization.
Key Features of Chemical KPI Scorecard in Google Sheets
Click to Buy Chemical KPI Scorecard in Google Sheets
This ready-to-use template includes several powerful features designed for easy performance monitoring.
Core Features
- Tracks 10 different KPIs
- Monthly dropdown selection
- Automatic number updates
- Traffic light performance indicators
- Up and down arrow comparisons
- MTD and YTD performance views
- KPI definition documentation
- Custom color settings
Because of automation, users only need to input data, and the dashboard updates automatically.
How Does the Chemical KPI Scorecard Work?
The scorecard operates using structured sheets connected through formulas.
Users select a month from the dropdown at the top. Immediately, the scorecard updates:
-
KPI values
-
Percentage changes
-
Traffic light colors
-
Performance arrows
Additionally, users can switch between:
-
MTD (Month-To-Date) view
-
YTD (Year-To-Date) view
Therefore, managers can analyze both short-term and long-term performance easily.
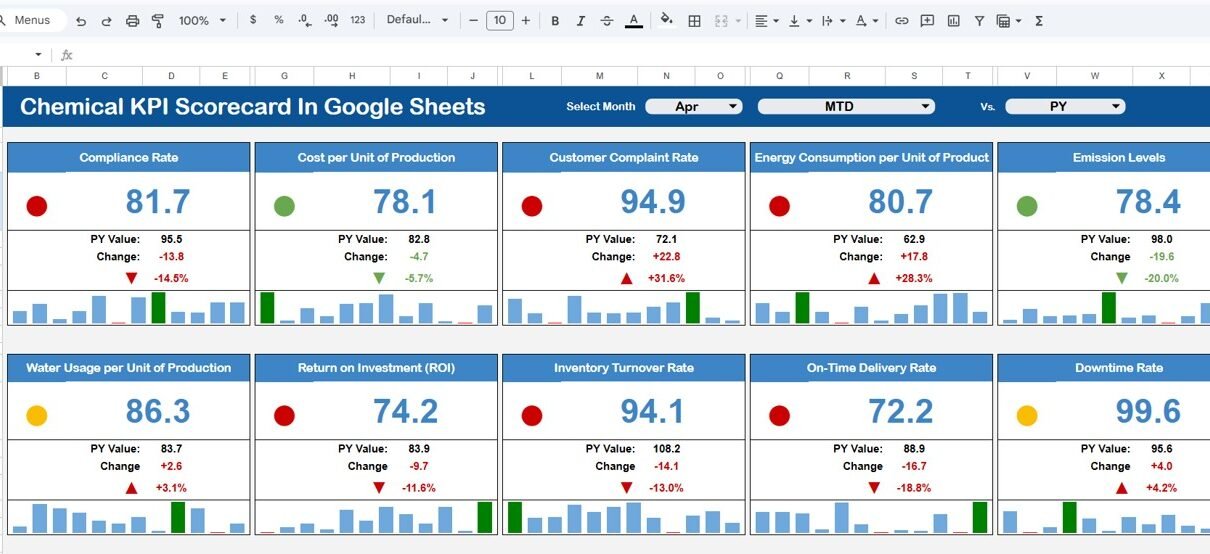
Dashboard Overview: Monthly KPI Scorecard
Click to Buy Chemical KPI Scorecard in Google Sheets
The main scorecard displays KPI performance in a clean and visual format.
Month Selection Feature
At the top of the dashboard:
-
A Month Dropdown allows users to select any reporting month.
-
All KPI numbers change automatically.
-
Traffic lights update based on KPI performance.
This dynamic feature enables quick monthly comparisons.
Performance Indicators Used
The dashboard includes visual performance indicators:
-
🟢 Green Traffic Light → KPI performing well
-
🟡 Yellow Traffic Light → Moderate performance
-
🔴 Red Traffic Light → Performance requires attention
Additionally:
-
▲ Up Arrow → Performance improvement
-
▼ Down Arrow → Performance decline
Because visuals simplify analysis, users understand performance immediately.

Click to Buy Chemical KPI Scorecard in Google Sheets
KPI Trend Sheet Tab – Performance Over Time
The Trend Sheet Tab helps users analyze individual KPI trends.
KPI Selection
- Dropdown available in Range C3
- Select any KPI dynamically
Once selected, the sheet displays:
- KPI Group
- KPI Unit
- KPI Type (Lower the Better / Upper the Better)
- KPI Formula
- KPI Definition
Therefore, managers can understand both KPI behavior and calculation logic.

Click to Buy Chemical KPI Scorecard in Google Sheets
KPI Definition Sheet Tab – KPI Documentation
The KPI Definition Sheet ensures consistency and clarity.
Users must enter:
- KPI Name
- KPI Group
- Unit
- Formula
- KPI Definition
This centralized documentation helps teams interpret KPIs correctly.
As a result, reporting remains standardized across departments.

Click to Buy Chemical KPI Scorecard in Google Sheets
Data Input Sheet Tab – Entering Performance Data
The Data Input Sheet serves as the data entry area.
Users simply input:
-
KPI values
-
Monthly performance data
-
MTD numbers
-
YTD numbers
After entering data, the scorecard updates automatically.
Because the system uses built-in formulas, manual calculations are unnecessary.

Click to Buy Chemical KPI Scorecard in Google Sheets
Colour Settings – Dashboard Customization
The template includes a Colour Settings section that allows users to customize visual appearance.
Organizations can:
-
Change traffic light colors
-
Adjust KPI performance thresholds
-
Modify dashboard theme colors
Therefore, companies can align the dashboard with corporate branding.

Click to Buy Chemical KPI Scorecard in Google Sheets
Advantages of Chemical KPI Scorecard in Google Sheets
Centralized KPI Monitoring
All metrics appear in one structured dashboard.
Easy Monthly Analysis
Dropdown selection simplifies reporting.
Visual Performance Indicators
Traffic lights make interpretation simple.
Real-Time Collaboration
Teams work together using cloud access.
Automated Calculations
Reduces human error significantly.
Flexible Customization
Add or modify KPIs easily.
Faster Decision-Making
Managers identify issues immediately.
How Does the Scorecard Improve Chemical Operations?
Click to Buy Chemical KPI Scorecard in Google Sheets
A KPI scorecard transforms raw operational data into actionable insights.
It helps organizations:
- Improve production efficiency
- Reduce operational risks
- Maintain quality standards
- Enhance safety monitoring
- Optimize cost management
Consequently, companies achieve operational excellence.
Best Practices for the Chemical KPI Scorecard in Google Sheets
To maximize dashboard effectiveness, follow these best practices.
1. Select Relevant KPIs
Choose KPIs aligned with business objectives.
2. Maintain Accurate Data Entry
Ensure consistent data input every month.
3. Review KPIs Regularly
Analyze trends instead of isolated values.
4. Define KPI Types Properly
Assign Lower or Upper the Better correctly.
5. Standardize KPI Definitions
Ensure all teams interpret KPIs equally.
6. Monitor Traffic Lights Carefully
Focus on red indicators first.
7. Update Data Consistently
Monthly updates maintain reliability.
Who Should Use This KPI Scorecard?
Click to Buy Chemical KPI Scorecard in Google Sheets
The Chemical KPI Scorecard benefits multiple roles.
- Plant Managers
- Production Supervisors
- Quality Managers
- Safety Officers
- Operations Analysts
- Business Executives
Because the template remains simple yet powerful, both small plants and large chemical enterprises can use it effectively.
Why Choose Google Sheets for KPI Tracking?
Google Sheets provides flexibility and accessibility.
Key Benefits
- Cloud-based platform
- No installation required
- Real-time collaboration
- Automatic saving
- Easy sharing with stakeholders
Therefore, it becomes an ideal reporting solution for modern organizations.
Future of KPI Monitoring in the Chemical Industry
Click to Buy Chemical KPI Scorecard in Google Sheets
The chemical industry increasingly adopts digital analytics tools. Companies now rely on performance dashboards to stay competitive.
Future trends include:
-
Predictive maintenance analytics
-
AI-driven performance forecasting
-
Real-time plant monitoring
-
Automated KPI reporting systems
Hence, KPI scorecards will continue playing a critical role in operational management.
Conclusion
Chemical companies must maintain efficiency, safety, and quality simultaneously. However, traditional reporting methods often slow decision-making and reduce visibility.
The Chemical KPI Scorecard in Google Sheets provides a simple yet powerful solution for monitoring performance through structured KPIs, automated calculations, and visual indicators.
By combining monthly and yearly analysis, trend monitoring, and centralized KPI definitions, this scorecard enables data-driven decision-making across the organization.
Ultimately, organizations that track KPIs consistently improve performance, reduce risks, and achieve sustainable growth.
Frequently Asked Questions (FAQs)
Click to Buy Chemical KPI Scorecard in Google Sheets
What is a Chemical KPI Scorecard?
It is a Google Sheets template used to track chemical industry performance using structured KPIs.
How many KPIs does this scorecard track?
The template tracks 10 different KPIs.
Can I customize KPIs?
Yes, you can modify KPIs using the KPI Definition sheet.
What is MTD and YTD?
-
MTD: Month-To-Date performance
-
YTD: Year-To-Date performance
Do I need advanced Google Sheets skills?
No. You only need to input data; formulas calculate results automatically.
Can multiple users access the scorecard?
Yes. Google Sheets allows real-time collaboration.
How often should data be updated?
You should update data monthly for accurate insights.
Visit our YouTube channel to learn step-by-step video tutorials
Youtube.com/@NeotechNavigators
Watch the step-by-step video tutorial: