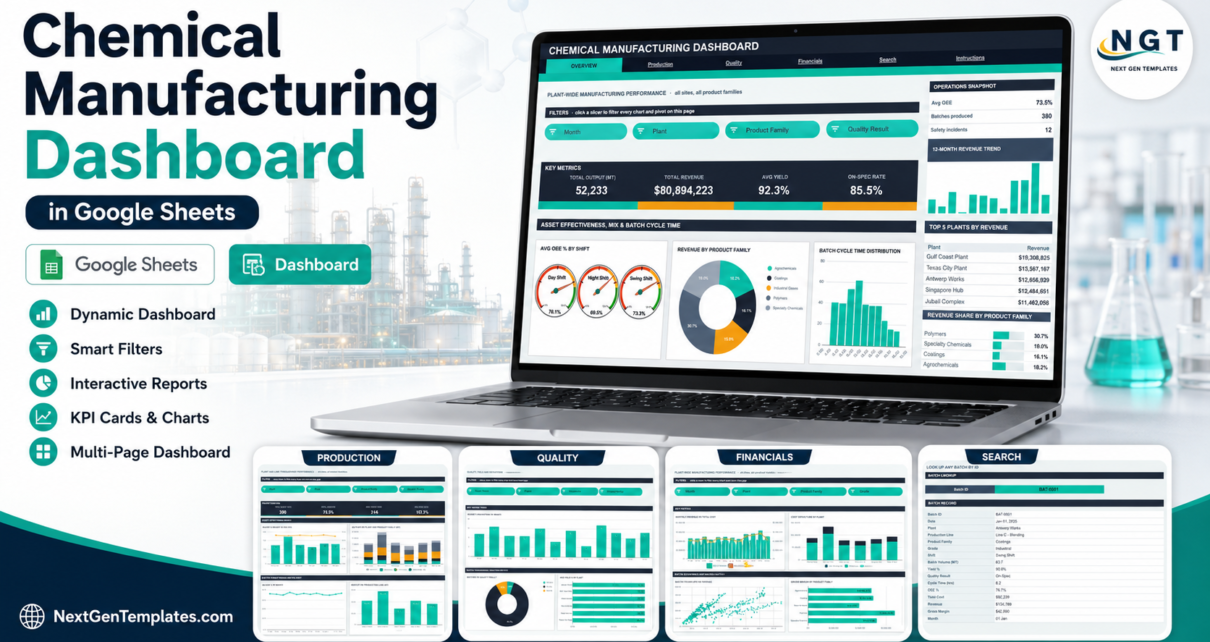
A production-reporting dashboard for chemical plants built entirely in Google Sheets: 6 tabs, 16 KPI cards, 18 native charts and 15 slicers over a 380-batch demo dataset covering output, yield, OEE, cost and margin.
Online Tutorial for Data Analysis and Automation
A production-reporting dashboard for chemical plants built entirely in Google Sheets: 6 tabs, 16 KPI cards, 18 native charts and 15 slicers over a 380-batch demo dataset covering output, yield, OEE, cost and margin.
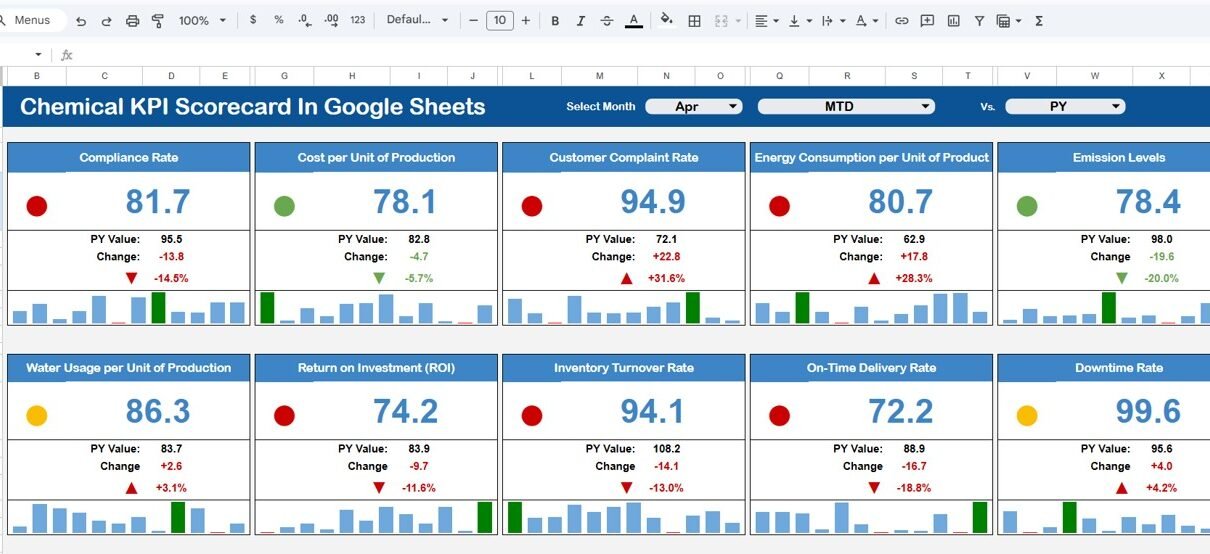
The chemical industry operates in a highly regulated, performance-driven, and efficiency-focused environment. Companies must continuously monitor production efficiency, safety performance, quality standards, operational costs, and environmental compliance. However, many chemical organizations still rely on manual spreadsheets and disconnected reports. As a result, managers struggle to evaluate performance quickly and accurately. So, how can chemical companies […]