Running a chiropractic clinic involves balancing patient care, operational efficiency, and business performance. To stay competitive and ensure smooth operations, you need to measure key performance indicators (KPIs) that reflect your clinic’s health. The Chiropractic Clinic KPI Dashboard in Google Sheets provides an all-in-one solution for tracking these metrics efficiently.Chiropractic Clinic KPI Dashboard in Google Sheets
In this article, we will explore how this dashboard works, its structure, benefits, and best practices for using it effectively.Chiropractic Clinic KPI Dashboard in Google Sheets
What Is a Chiropractic Clinic KPI Dashboard?
A Chiropractic Clinic KPI Dashboard is a structured, data-driven tool that consolidates clinical and operational metrics into one central view. It helps clinic managers and practitioners monitor Month-to-Date (MTD) and Year-to-Date (YTD) performance, compare results against targets, and identify improvement areas.
With this Google Sheets-based dashboard, you can track essential KPIs such as:
-
Number of new patients
-
Appointment attendance rate
-
Average treatment revenue
-
Patient satisfaction score
-
Revisit rate and staff efficiency
Key Features of the Chiropractic Clinic KPI Dashboard
Click to Buy Chiropractic Clinic KPI Dashboard in Google Sheets
The dashboard is divided into six key worksheets, each designed for a specific function.
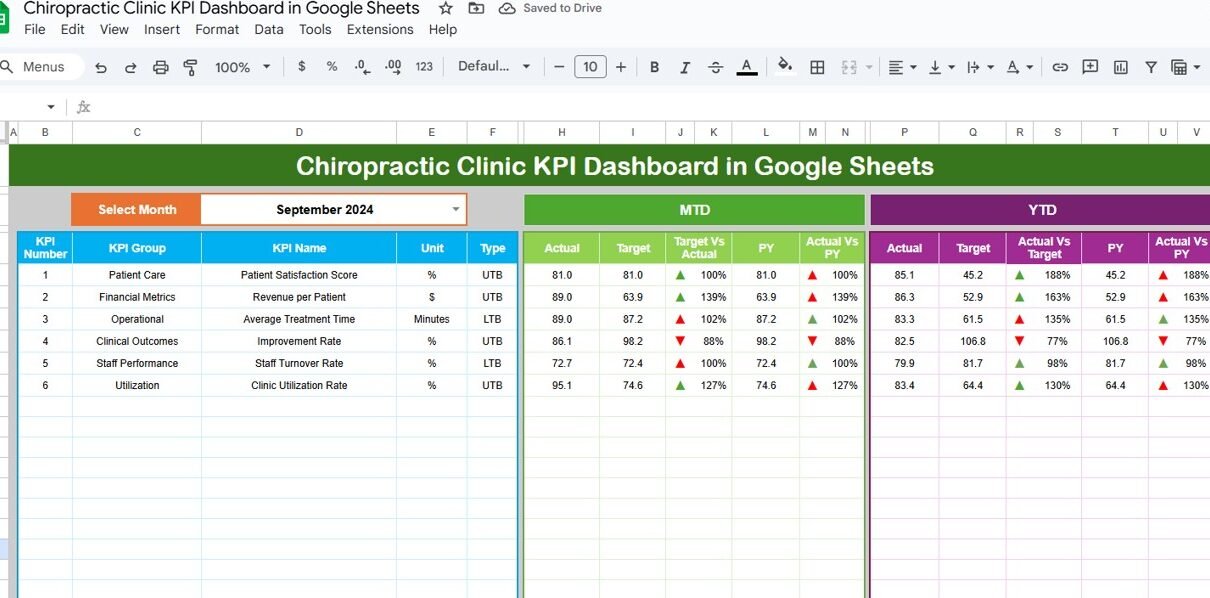
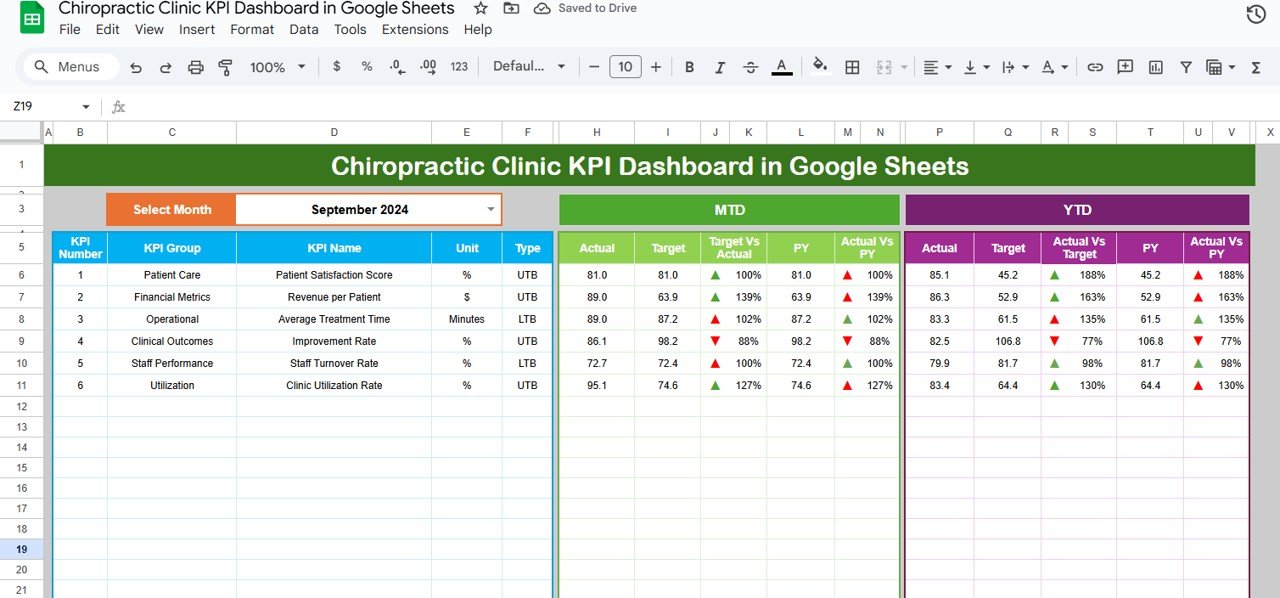
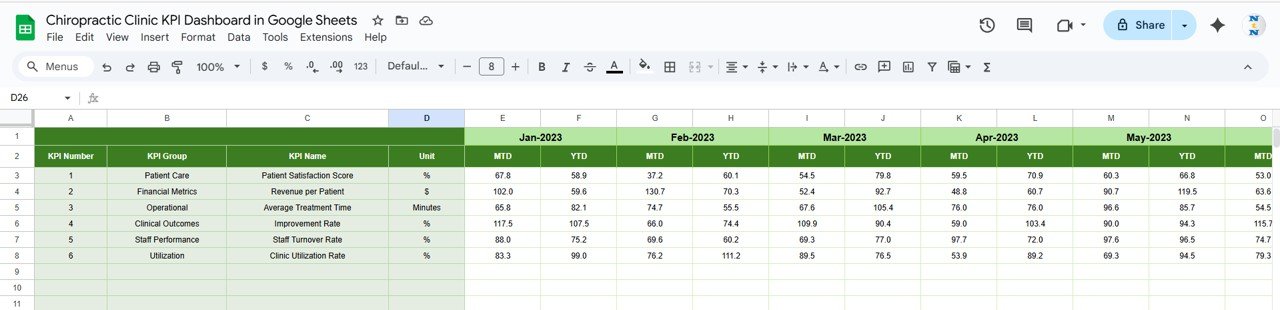
1. Dashboard Sheet Tab
This is the main page of the dashboard where all KPI results are displayed.
-
Dynamic Month Selection: You can select the reporting month from a dropdown (cell range D3).
-
Automatic Updates: All MTD and YTD figures update based on your selected month.
-
Visual Indicators: Conditional formatting shows red ▼ or green ▲ arrows to indicate whether a KPI meets or misses its target.
-
Performance Comparison: Displays actuals vs. targets and compares against the previous year.
KPIs are shown with both MTD and YTD values, giving you a clear overview of progress.
Click to Buy Chiropractic Clinic KPI Dashboard in Google Sheets
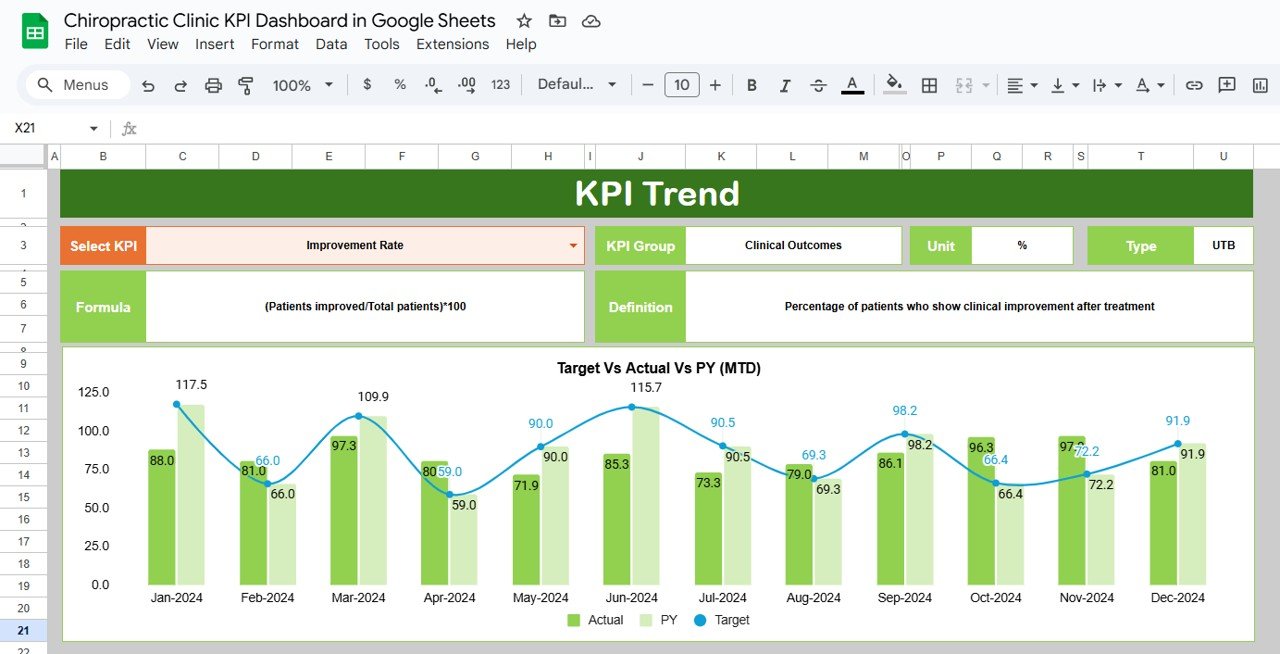
2. KPI Trend Sheet Tab
This sheet helps you analyze trends and understand long-term performance patterns.
-
Select a KPI name from the dropdown (cell C3).
-
View details such as KPI Group, Unit, Type (UTB/LTB), and Formula.
-
Charts visualize historical performance trends.
This tab is useful for identifying patterns, seasonal variations, or consistent performance issues.
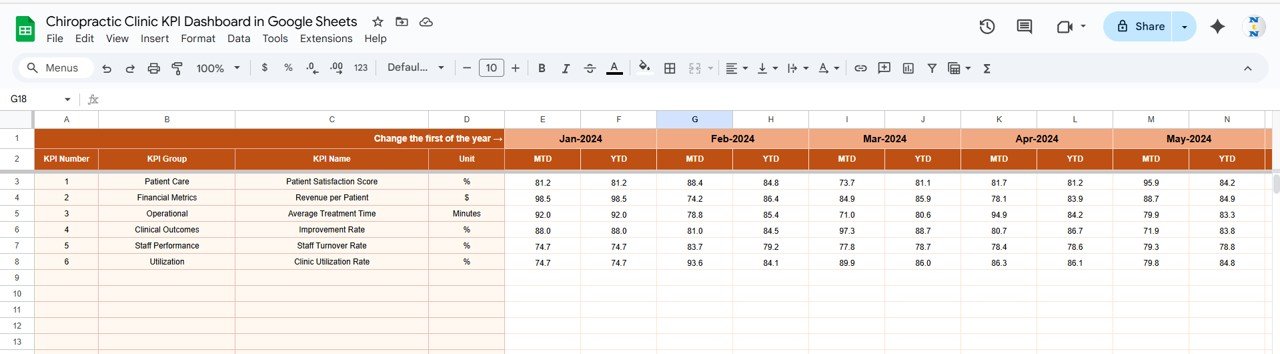
3. Actual Numbers Sheet Tab
-
Enter actual performance data for MTD and YTD by month.
-
Change the first month of the reporting year in cell E1 to automatically refresh calculations.
-
Keep this data accurate to ensure the dashboard remains reliable.
Click to Buy Chiropractic Clinic KPI Dashboard in Google Sheets
4. Target Sheet Tab
Set the target values for each KPI:
-
Enter both MTD and YTD targets by month.
-
Helps evaluate actual performance against expectations.
-
Supports continuous improvement and realistic goal-setting.
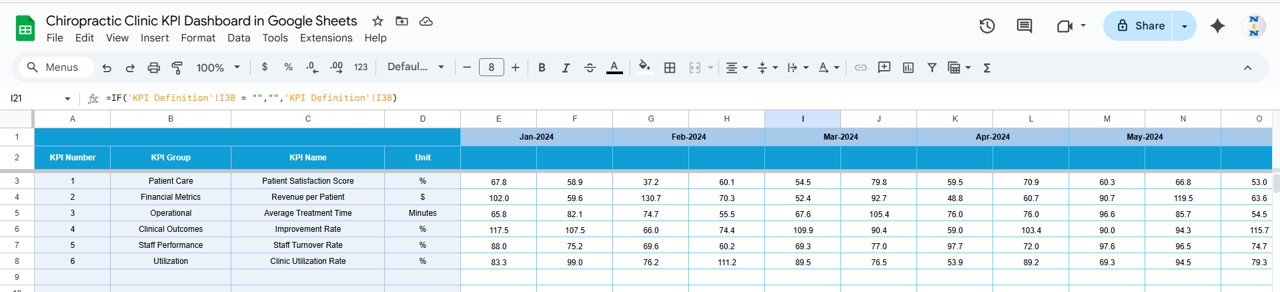
5. Previous Year Numbers Sheet Tab
This sheet stores performance data from the previous year:
-
Enables year-over-year comparisons.
-
Useful for analyzing growth trends and evaluating strategic initiatives.
Click to Buy Chiropractic Clinic KPI Dashboard in Google Sheets
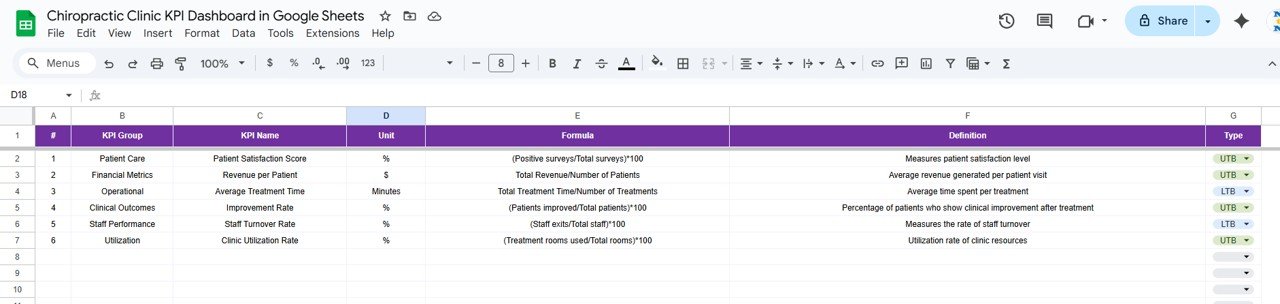
6. KPI Definition Sheet Tab
Defines each KPI clearly with:
-
KPI Name
-
KPI Group
-
Unit of Measure
-
Formula
-
Definition
-
Performance Type (UTB or LTB)
Advantages of Using the Chiropractic Clinic KPI Dashboard
Click to Buy Chiropractic Clinic KPI Dashboard in Google Sheets
-
Centralized View: Access all clinical and business KPIs in one dashboard.
-
Data-Driven Insights: Make informed decisions backed by real numbers.
-
Easy Tracking: Monitor MTD, YTD, and previous year comparisons.
-
Performance Visibility: Quickly identify high-performing areas or departments.
-
Customizable: Add new KPIs or adapt formulas based on your clinic’s needs.
-
Visual Indicators: Use color-coded arrows and charts for instant interpretation.
Best Practices for Using the Dashboard
-
Update Data Monthly: Keep actual and target data current for accurate reporting.
-
Standardize KPI Definitions: Maintain consistency in how each KPI is calculated.
-
Use Trend Analysis: Review patterns to identify issues before they escalate.
-
Set Realistic Targets: Align goals with past performance and business objectives.
-
Share Insights: Use dashboard visuals in team meetings to improve accountability.
-
Track Both UTB and LTB KPIs: Balance performance by monitoring where higher or lower values indicate success.
How This Dashboard Helps Chiropractic Clinics
Click to Buy Chiropractic Clinic KPI Dashboard in Google Sheets
-
Improves Operational Efficiency: Tracks response times, patient flow, and staff performance.
-
Enhances Patient Experience: Monitors satisfaction and treatment outcomes.
-
Supports Revenue Growth: Identifies trends in patient retention and revenue generation.
-
Data Transparency: Makes reporting clear and measurable for managers and owners.
-
Encourages Continuous Improvement: Provides a foundation for data-driven goal-setting.
Frequently Asked Questions (FAQs)
Q1: Can I customize the KPIs in this dashboard?
Yes, you can modify existing KPIs or add new ones relevant to your clinic operations.
Q2: How often should I update the data?
Ideally, update it monthly to track MTD and YTD performance consistently.
Q3: Can I use this dashboard for multiple branches?
Yes. You can add filters or additional sheets to track performance by location.
Q4: Does this dashboard require advanced Google Sheets skills?
No. It’s beginner-friendly and uses formulas and dropdowns for easy navigation.
Q5: Can I analyze trends over time?
Yes. The KPI Trend Sheet lets you track progress across months and years.
Conclusion
Click to Buy Chiropractic Clinic KPI Dashboard in Google Sheets
The Chiropractic Clinic KPI Dashboard in Google Sheets is a powerful, easy-to-use tool that provides a clear overview of clinic performance. By consolidating key metrics, tracking trends, and comparing results against targets, clinic managers can make better decisions, enhance patient satisfaction, and drive continuous improvement.
Whether you manage a small private clinic or a multi-location practice, this dashboard ensures you have full visibility into your operations — all within the simplicity and flexibility of Google Sheets.
Visit our YouTube channel to learn step-by-step video tutorials
Youtube.com/@NeotechNavigators
Watch the step-by-step video Demo:
Click to Buy Chiropractic Clinic KPI Dashboard in Google Sheets