Cloud infrastructure powers modern digital businesses. However, without continuous monitoring, cloud costs, performance, and availability can quickly go out of control. That is exactly why a Cloud Computing KPI Dashboard in Google Sheets becomes essential.
This ready-to-use Cloud Computing KPI Dashboard in Google Sheets helps organizations track operational, financial, performance, and reliability KPIs in one centralized view. It enables teams to compare Actual vs Target, Year-over-Year performance, and MTD & YTD trends using dynamic visuals and structured data.
What Is a Cloud Computing KPI Dashboard in Google Sheets?
A Cloud Computing KPI Dashboard in Google Sheets is an interactive analytics solution designed to monitor cloud performance, cost efficiency, usage, and reliability metrics.
Instead of reviewing raw cloud reports, teams can instantly:
- Track monthly and yearly cloud KPIs
- Compare actual performance against targets
- Identify cost overruns early
- Monitor availability and performance trends
- Support data-driven cloud optimization decisions
Because the dashboard is built in Google Sheets, it remains cloud-based, collaborative, and easy to maintain.
Key Features of Cloud Computing KPI Dashboard in Google Sheets
Click to Buy Cloud Computing KPI Dashboard in Google Sheets
This Cloud Computing KPI Dashboard is structured using 6 interconnected worksheets, each designed for a specific purpose.
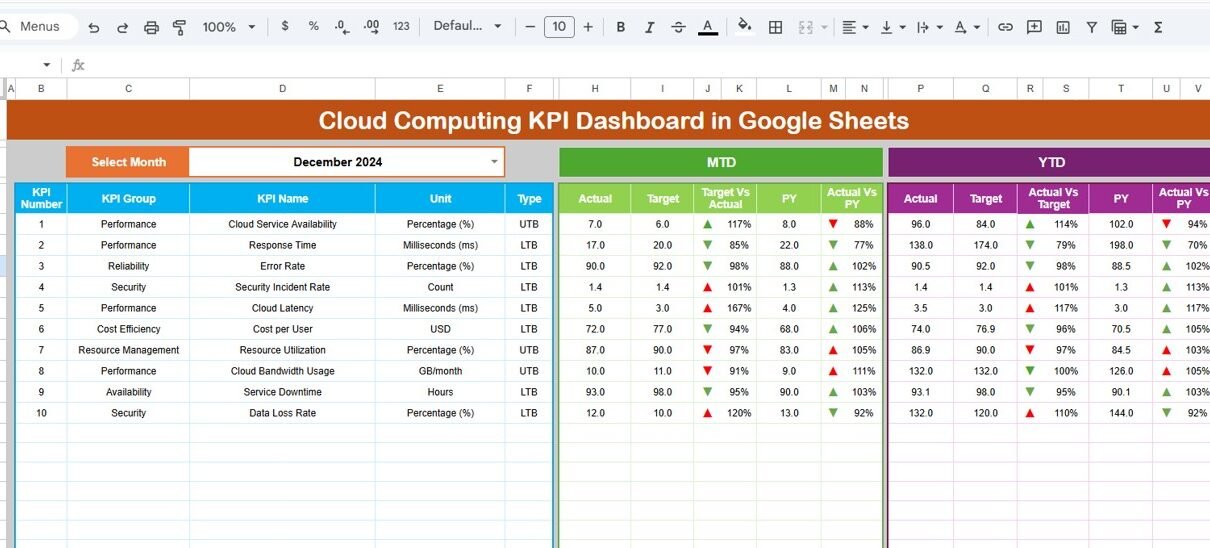
Dashboard Sheet Tab (Main Dashboard)
The Dashboard Sheet is the core analytics page.
Key Highlights:
-
Month selection dropdown at Cell D3
-
Entire dashboard updates automatically based on selected month
-
Displays MTD and YTD performance
Metrics Displayed:
- MTD Actual, Target, Previous Year
- Target vs Actual (with up/down arrows)
- Previous Year vs Actual (with up/down arrows)
- YTD Actual, Target, Previous Year
- Conditional formatting for quick performance interpretation
This layout allows stakeholders to assess short-term and long-term cloud performance instantly.

Click to Buy Cloud Computing KPI Dashboard in Google Sheets
KPI Trend Sheet Tab
The KPI Trend Sheet enables detailed KPI-level analysis.
Key Features:
-
KPI selection dropdown at Cell C3
Displays:
- KPI Group
- KPI Unit
- KPI Type (LTB / UTB)
- KPI Formula
- KPI Definition
Trend Analysis:
-
MTD trend chart (Actual, Target, PY)
-
YTD trend chart (Actual, Target, PY)
This sheet helps identify performance patterns, anomalies, and improvement areas.

Click to Buy Cloud Computing KPI Dashboard in Google Sheets
Actual Number Sheet Tab
The Actual Number Sheet stores real cloud performance data.
How It Works:
-
Enter actual MTD and YTD values
-
Change the first month of the year in Cell E1
-
Dashboard updates automatically for all months
This ensures consistent and accurate actual performance tracking.

Click to Buy Cloud Computing KPI Dashboard in Google Sheets
Target Sheet Tab
The Target Sheet captures planned KPI targets.
Key Functions:
-
Enter monthly MTD targets
-
Enter cumulative YTD targets
-
Supports variance and achievement analysis
Separating targets from actuals improves planning clarity.

Click to Buy Cloud Computing KPI Dashboard in Google Sheets
Previous Year Number Sheet Tab
The Previous Year Sheet stores historical KPI values.
Benefits:
-
Enables year-over-year comparison
-
Highlights performance improvement or decline
-
Supports long-term cloud optimization analysis

Click to Buy Cloud Computing KPI Dashboard in Google Sheets
KPI Definition Sheet Tab
The KPI Definition Sheet acts as the KPI master table.
Information Maintained:
- KPI Name
- KPI Group
- Unit
- Formula
- KPI Definition
- KPI Type (LTB / UTB)
This ensures KPI consistency and avoids interpretation errors.

Click to Buy Cloud Computing KPI Dashboard in Google Sheets
Advantages of Cloud Computing KPI Dashboard in Google Sheets
-
Centralized cloud performance monitoring
-
Real-time MTD and YTD analysis
-
Cost and performance visibility in one place
-
Easy collaboration using Google Sheets
-
No expensive BI tools required
-
Ready-to-use and customizable
Best Practices for Cloud Computing KPI Dashboard
Click to Buy Cloud Computing KPI Dashboard in Google Sheets
-
Define KPIs clearly in the KPI Definition sheet
-
Update actual numbers regularly
-
Review cost KPIs monthly
-
Monitor performance and availability trends
-
Avoid tracking too many KPIs at once
-
Use trend insights for proactive optimization
Conclusion
The Cloud Computing KPI Dashboard in Google Sheets provides a powerful yet simple way to monitor cloud cost, performance, reliability, and usage metrics. By combining MTD, YTD, target comparison, and trend analysis, this dashboard helps organizations control cloud spend and improve operational efficiency.
Because it is ready to use, cloud-based, and fully customizable, this dashboard is ideal for IT teams, cloud architects, finance teams, and business leaders.
Visit our YouTube channel to learn step-by-step video tutorials
Youtube.com/@NeotechNavigators
Watch the step-by-step video tutorial: