Monitoring key performance indicators (KPIs) in construction projects is essential for ensuring timely delivery, budget compliance, and overall project efficiency. The Construction KPI Scorecard in Google Sheets is a ready-to-use template designed to track and visualize project performance metrics in real-time.
This article explains the key features, advantages, best practices, and usage of this Construction KPI Scorecard.
What Is a Construction KPI Scorecard?
A Construction KPI Scorecard is an interactive Google Sheets template that consolidates project performance metrics in one place. It provides insights into critical KPIs such as project completion, budget utilization, safety compliance, and quality measures.
By using this scorecard, project managers, site supervisors, and stakeholders can:
-
Monitor monthly and yearly KPI performance
-
Compare actual results against targets and previous year data
-
Identify trends and areas needing improvement
-
Make data-driven decisions to optimize project outcomes
Key Features of the Construction KPI Scorecard
This scorecard includes multiple tabs for comprehensive performance tracking:
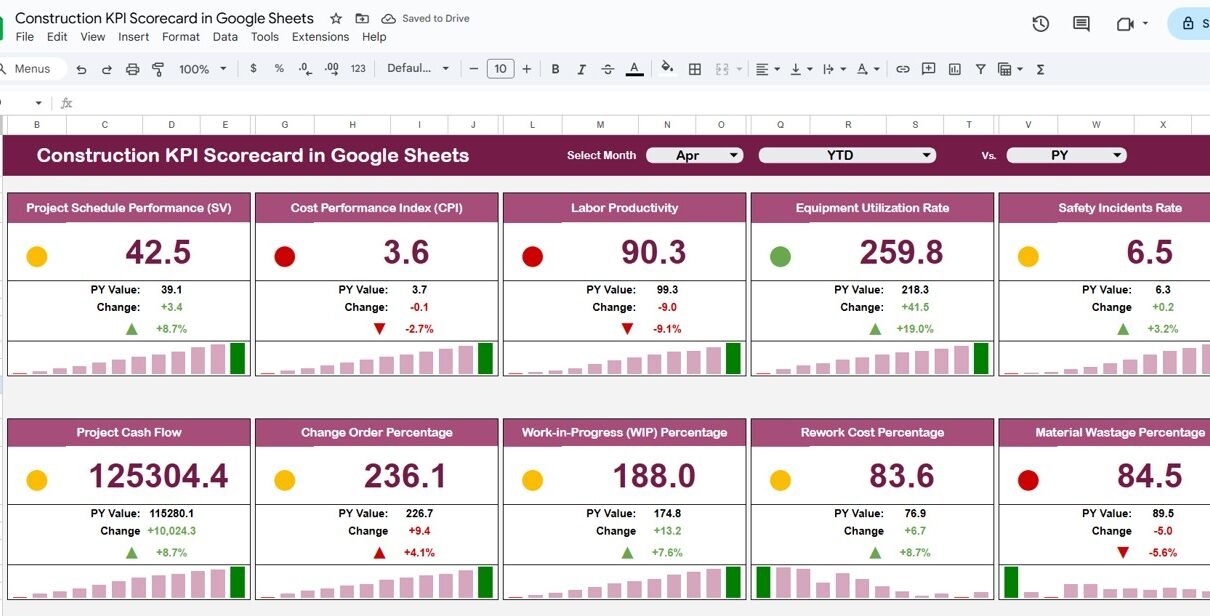
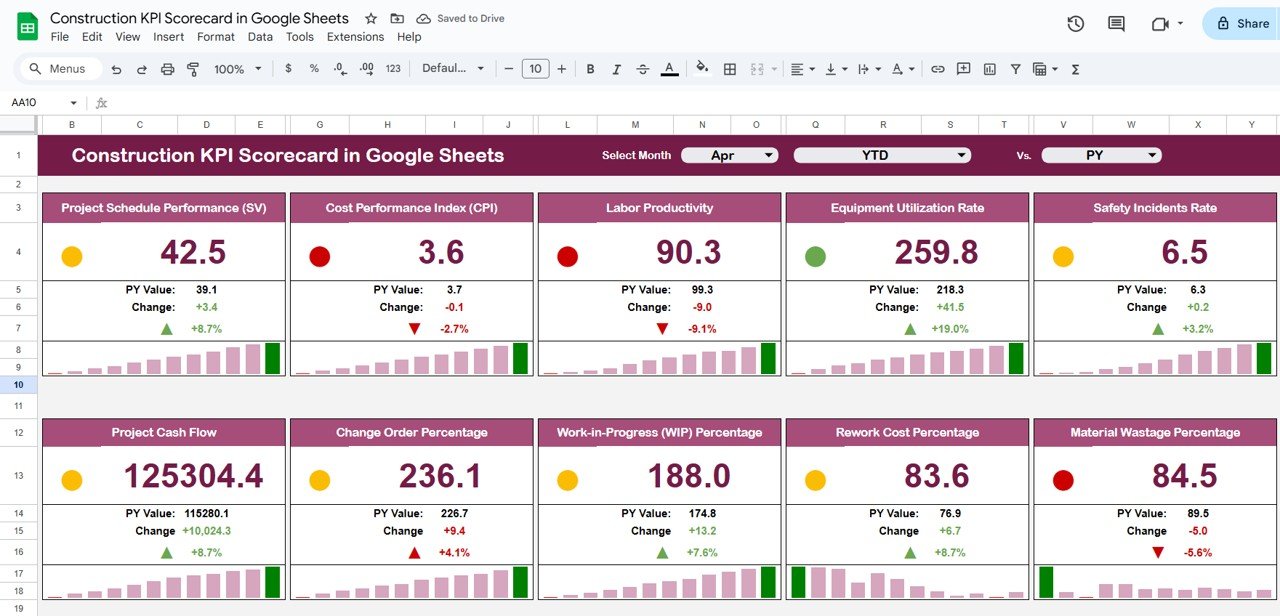
1. Scorecard Sheet Tab
The Scorecard Sheet is the main dashboard that displays KPIs using cards, traffic lights, and charts:
Cards and Visuals:
-
Top Section: Displays 10 KPIs for quick evaluation
-
Month Dropdown: Select any month to view monthly data; automatically updates numbers, traffic lights, and up/down arrow percentages
-
MTD & YTD Toggle: Click to switch between Month-to-Date (MTD) and Year-to-Date (YTD) performance
Click to Buy Construction KPI Scorecard in Google Sheets
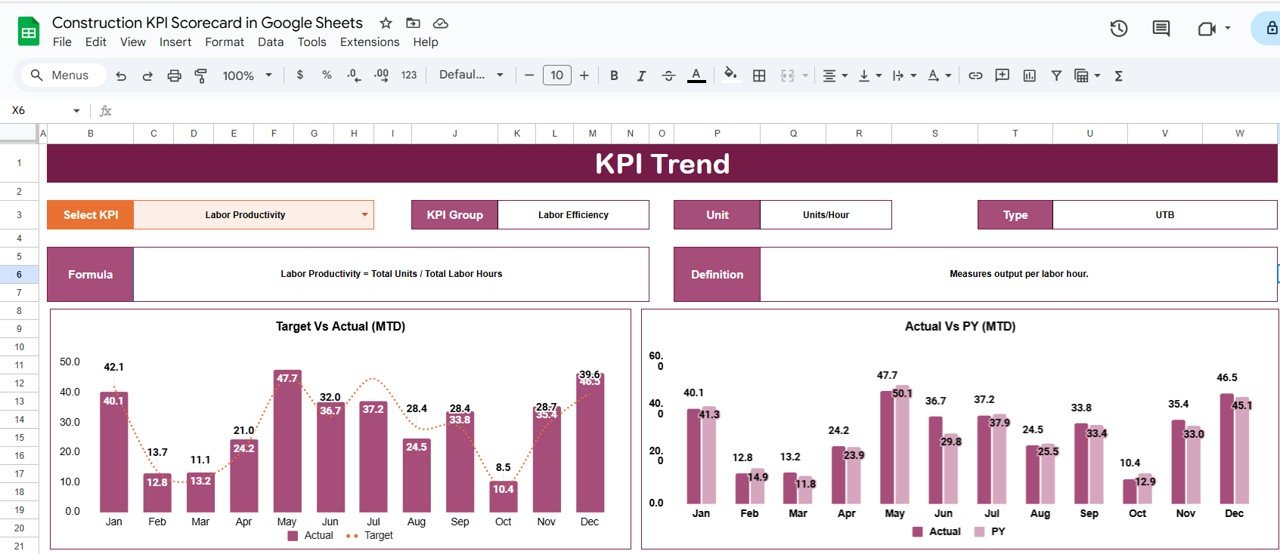
2. Trend Sheet Tab
The Trend Sheet provides detailed insights for each KPI:
-
Select a KPI from the dropdown in Range C3
-
Displays KPI Group, Unit, and Type (Lower-the-Better or Upper-the-Better)
-
Shows formula and KPI definition
-
Tracks performance trends over time
This sheet helps managers identify trends, bottlenecks, and areas for improvement.
Click to Buy Construction KPI Scorecard in Google Sheets
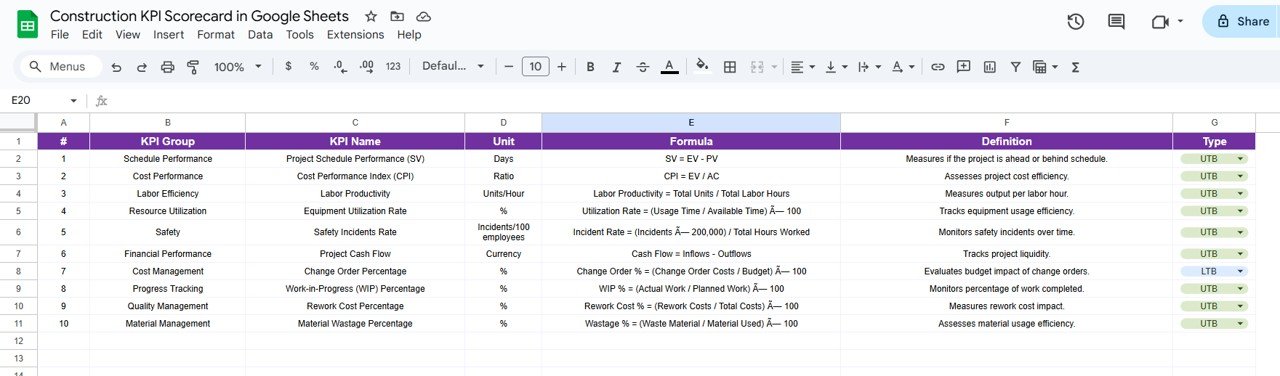
3. KPI Definition Sheet Tab
The KPI Definition Sheet serves as a reference for all KPIs:
-
Record KPI Name, KPI Group, Unit, Formula, and Definition
-
Specify whether higher or lower values are preferable (UTB or LTB)
-
Ensures consistency in measurement and reporting
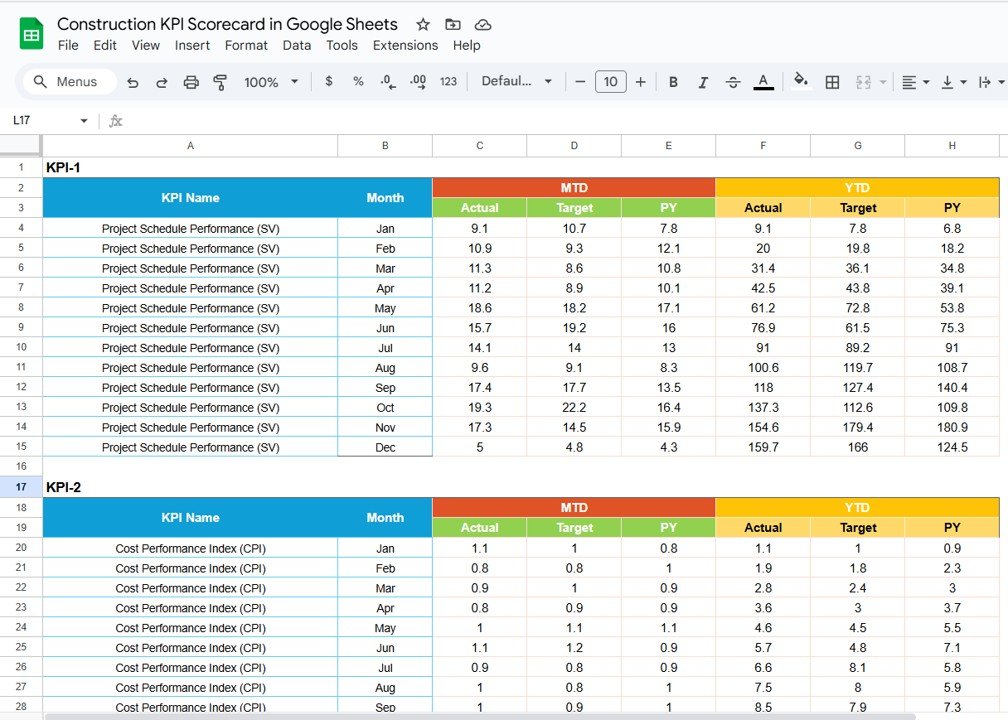
4. Data Input Sheet Tab
The Data Input Sheet is where actual performance numbers are entered:
-
Capture monthly and yearly data for each KPI
-
Automatic updates reflect in the Scorecard and Trend sheets
-
Maintain a centralized record for analysis and reporting
Click to Buy Construction KPI Scorecard in Google Sheets
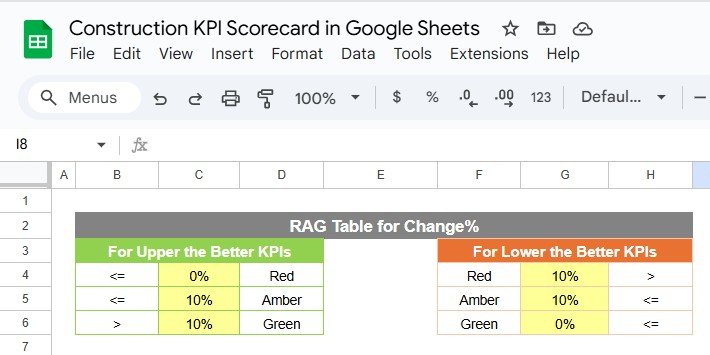
5. Color Settings
-
Customize traffic light colors for each KPI
-
Adjust conditional formatting to highlight underperformance or targets achieved
-
Makes the dashboard visually intuitive and easy to interpret
Advantages of Using the Construction KPI Scorecard
-
Centralized KPI Tracking: Monitor all key performance metrics in one Google Sheet
-
Real-Time Analysis: Updates automatically when new data is entered
-
Visual Insights: Traffic lights, arrows, and charts provide clear performance indicators
-
Trend Analysis: Track monthly and yearly performance with ease
-
Data-Driven Decisions: Quickly identify underperforming KPIs and take corrective action
-
Customizable: Add or remove KPIs, adjust formulas, and change colors based on project requirements
Best Practices for Using the Scorecard
Click to Buy Construction KPI Scorecard in Google Sheets
-
Update Data Regularly: Keep monthly and yearly data current for accurate tracking
-
Focus on Critical KPIs: Prioritize metrics that impact project timelines, budgets, and quality
-
Monitor Trends: Use the Trend Sheet to identify improvements or declines
-
Use Visual Indicators: Traffic lights and arrows help quickly spot issues
-
Document Changes: Maintain a record of updates and adjustments for transparency
Examples of KPIs to Track
Some KPIs commonly included in a construction scorecard are:
-
Project Completion Rate (%) – Measure progress against milestones
-
Budget Utilization ($) – Track planned vs. actual spending
-
Safety Incidents (#) – Monitor safety performance
-
Labor Productivity (Hours/Unit) – Measure workforce efficiency
-
Quality Compliance (%) – Ensure standards are met
-
Equipment Utilization (%) – Optimize machinery and resources
-
On-Time Task Completion (%) – Track schedule adherence
Each KPI should include:
-
Unit of Measure (e.g., %, $, hours)
-
Formula for calculation
-
Type (Upper-the-Better / Lower-the-Better)
How This Scorecard Helps Construction Managers
Click to Buy Construction KPI Scorecard in Google Sheets
-
Track Performance Easily: Centralized view of all KPIs
-
Identify Problem Areas: Spot issues in budget, schedule, or quality
-
Monitor Progress: Compare monthly and yearly trends
-
Enhance Accountability: Assign KPIs to teams or departments
-
Optimize Resources: Improve efficiency in workforce, equipment, and budget allocation
Frequently Asked Questions (FAQs)
Click to Buy Construction KPI Scorecard in Google Sheets
Q1: Can I add more KPIs to the scorecard?
Yes, you can add additional KPIs by updating the KPI Definition Sheet and Data Input Sheet.
Q2: How do I switch between monthly and yearly views?
Click the MTD (Month-to-Date) or YTD (Year-to-Date) toggle on the Scorecard Sheet.
Q3: Are traffic lights and arrows customizable?
Yes, use the Color Settings tab to adjust traffic light colors and arrow thresholds.
Q4: Can multiple team members update the scorecard?
Yes, Google Sheets allows real-time collaboration for multiple users.
Q5: Can I track KPI trends over time?
Absolutely. The Trend Sheet visualizes performance across months and years.
Conclusion
Click to Buy Construction KPI Scorecard in Google Sheets
The Construction KPI Scorecard in Google Sheets is a powerful, ready-to-use tool for monitoring project performance. With visual dashboards, trend analysis, and flexible data input, it enables construction managers to track progress, optimize resources, and make informed decisions for project success.
Visit our YouTube channel to learn step-by-step video tutorials
Youtube.com/@NeotechNavigators
Watch the step-by-step video Demo: