Running a convenience store involves tracking hundreds of small but critical details — sales performance, inventory levels, customer satisfaction, and profitability. Managing all this data manually can be overwhelming. However, with a Convenience Store KPI Dashboard in Google Sheets, you can easily visualize, monitor, and manage your business performance in one place.
This article explains what this dashboard is, how it works, its benefits, structure, and best practices to help you use it effectively for your store’s success.
Click to buy Convenience Store KPI Dashboard in Google Sheets
What Is a Convenience Store KPI Dashboard in Google Sheets?
A Convenience Store KPI Dashboard is an analytical tool built in Google Sheets that helps store owners measure and analyze their Key Performance Indicators (KPIs). These KPIs include sales revenue, average transaction value, foot traffic, product margins, and inventory turnover — all essential for daily decision-making.
Unlike complex software, this Google Sheets dashboard offers a simple, user-friendly, and cloud-based solution. You can track real-time data, visualize trends through charts, and share insights instantly with your team.
This dashboard consolidates all vital metrics into one visual view, empowering you to make faster and smarter business decisions.
Why Use Google Sheets for KPI Tracking?
Google Sheets provides flexibility, automation, and accessibility — making it ideal for small and medium-sized retail businesses. Here’s why it’s the perfect tool for convenience store analytics:
- Cloud-based access: You can view and edit your dashboard from anywhere.
- Collaboration-friendly: Share live data with your staff or business partners.
- Automation-ready: Use formulas and scripts to update KPIs automatically.
- Cost-effective: No expensive software or licenses required.
- Visualization power: Create charts, trend lines, and conditional formatting to highlight performance.
These features make Google Sheets a powerful yet budget-friendly platform for KPI tracking.
Structure of the Convenience Store KPI Dashboard in Google Sheets
This dashboard includes six key worksheets, each serving a specific purpose. Let’s explore them one by one.
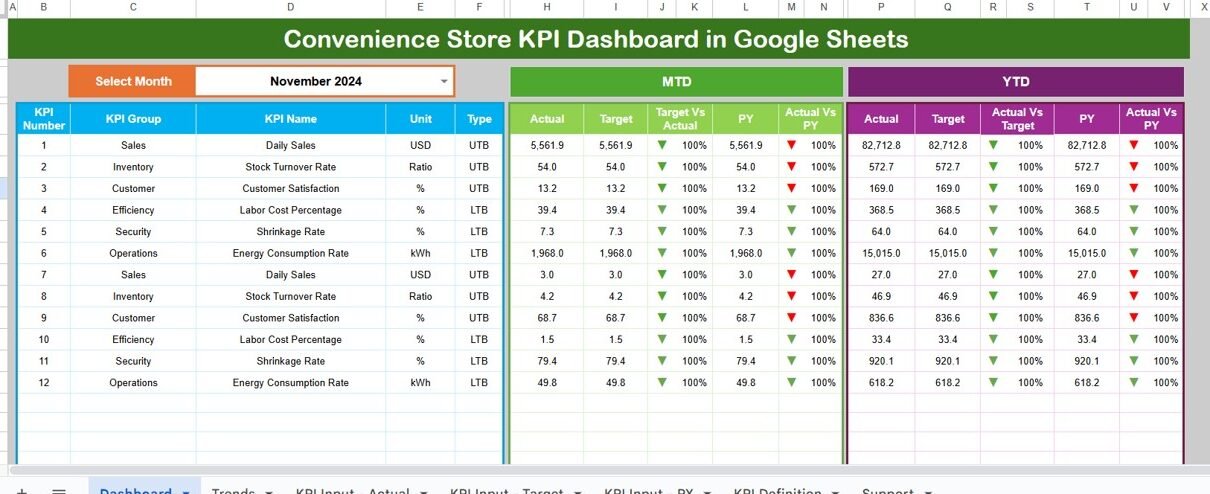
Dashboard Sheet
This is the main control panel of your KPI dashboard. It gives an overall summary of your store’s monthly and yearly performance.
- Select the Month from the drop-down (cell D3).
- Instantly, all KPIs update for that selected month.
- View both MTD (Month-to-Date) and YTD (Year-to-Date) data.
- Compare Actual vs Target and Previous Year vs Current Year.
- Conditional formatting shows up and down arrows to indicate performance trends.
This visual summary helps managers quickly identify which areas need attention — whether it’s declining sales, rising costs, or low profit margins.

Click to buy Convenience Store KPI Dashboard in Google Sheets
Trend Sheet
The Trend Sheet helps you analyze performance patterns over time. It includes:
- KPI selection drop-down in cell C3.
- KPI details: Group, Unit, Type (UTB or LTB), Formula, and Definition.
- Two charts — one for MTD Trend and one for YTD Trend showing Actual, Target, and Previous Year data.
By visualizing trends, you can easily identify seasonal variations, growth patterns, and declining KPIs.

Click to buy Convenience Store KPI Dashboard in Google Sheets
Actual Numbers Input Sheet
This is the data entry sheet where you record monthly and yearly actual numbers.
- Enter MTD and YTD data for each KPI.
- Set the first month of the year in cell E1 to align the reporting cycle.
- You can update data monthly, and the dashboard automatically recalculates and refreshes all visuals.
This structure ensures your dashboard always reflects real-time store performance.

Target Sheet
The Target Sheet stores your monthly and yearly targets for each KPI.
- Input both MTD and YTD targets for every KPI.
- The dashboard compares these targets with actual results to measure performance gaps.
- The use of conditional formatting (green for meet, red for miss) helps you instantly spot underperforming KPIs.
This feature ensures your team remains goal-oriented throughout the year.

Click to buy Convenience Store KPI Dashboard in Google Sheets
Previous Year Number Sheet
Tracking performance improvement requires benchmarking against past data. In this sheet:
- Enter the previous year’s actual data (MTD and YTD).
- The dashboard automatically calculates growth or decline percentages compared to the current year.
This comparison helps identify consistent performance patterns and areas needing improvement.

Click to buy Convenience Store KPI Dashboard in Google Sheets
kPI Definition Sheet
Every KPI must be clearly defined to avoid confusion. This sheet includes:
- KPI Name
- KPI Group
- Unit of Measurement
- Formula
- Definition
- KPI Type (UTB or LTB)
Having this sheet helps users understand the logic behind each KPI, ensuring everyone interprets data correctly.

Advantages of Using a Convenience Store KPI Dashboard in Google Sheets
Let’s explore how this tool can transform your convenience store operations.
1. Centralized Performance Monitoring
All KPIs are consolidated in one dashboard, making it easy to view overall store performance. Managers no longer need to check multiple spreadsheets or reports.
2. Real-Time Updates
With formulas and automation, the dashboard updates in real-time whenever data changes. You can always rely on the most recent figures for decision-making.
3. Trend Analysis
Visual trend charts make it simple to identify performance fluctuations and predict future outcomes. You can proactively plan promotions or stock adjustments.
4. Cost-Effective Tool
Google Sheets is free and cloud-based. You don’t need expensive analytics software or licenses to monitor KPIs.
5. Team Collaboration
Multiple users can access and update the dashboard simultaneously. This fosters teamwork and transparency in store management.
6. Data-Driven Decision Making
With clear visuals and comparisons, you can easily identify top-performing categories, peak sales hours, and seasonal trends — enabling informed strategic decisions.
How to Use the Convenience Store KPI Dashboard Effectively
Using this dashboard efficiently involves a few simple yet powerful steps:
- Collect Accurate Data: Ensure your sales, inventory, and expense data are up-to-date.
- Update Actual and Target Sheets Monthly: Enter your actual results and targets regularly.
- Review Dashboard Weekly: Monitor trends to identify performance gaps.
- Adjust Strategies Accordingly: Take corrective actions on underperforming KPIs.
- Communicate Insights: Share findings with your staff to motivate improvement.
When used consistently, this dashboard can significantly improve your store’s operational visibility and profitability.
Opportunities for Improvement in Dashboard Usage
While this dashboard provides excellent value, there’s always room to enhance its efficiency.
- Add automation scripts: Use Google Apps Script to auto-import data from POS systems.
- Integrate visual reports: Connect Google Sheets with Google Data Studio for advanced visualization.
- Expand KPI coverage: Include employee productivity or supplier performance metrics.
- Set conditional alerts: Create alerts for KPIs that fall below a set threshold.
- Implement historical trend storage: Maintain multi-year data for deeper analysis.
These improvements can make your dashboard even more powerful and business-ready.
Best Practices for the Convenience Store KPI Dashboard
To get the best results from your KPI Dashboard, follow these practical tips:
Define KPIs Clearly
Ensure everyone on your team understands what each KPI represents and how it’s calculated.
Automate Data Entry
Reduce manual effort by linking your dashboard with POS or accounting software.
Use Color Coding
Leverage Google Sheets’ conditional formatting to highlight high and low performers visually.
Set SMART Targets
Your KPIs should have Specific, Measurable, Achievable, Relevant, and Time-bound goals.
Schedule Regular Reviews
Analyze KPIs weekly or monthly to ensure performance stays aligned with business goals.
Backup Your Data
Always maintain a backup copy of your dashboard to prevent data loss.
By following these practices, you’ll ensure your dashboard delivers consistent and accurate insights.
Conclusion
A Convenience Store KPI Dashboard in Google Sheets is an essential management tool for every store owner who wants to make data-driven decisions. It provides a complete picture of store performance — from sales and inventory to profitability and customer satisfaction.
By leveraging Google Sheets’ automation, charting, and collaboration features, you can build a flexible and dynamic system without spending a fortune on software. Whether you run a single outlet or a chain of stores, this dashboard helps you focus on what truly matters — growing your business efficiently.
Frequently Asked Questions (FAQs)
1. What is a Convenience Store KPI Dashboard?
It’s a Google Sheets-based tool that tracks key performance indicators like sales, profit, and inventory to measure store performance.
2. How often should I update my KPI Dashboard?
You should update your dashboard at least once a month. However, for daily insights, you can integrate it with your POS system.
3. Can I customize KPIs in the dashboard?
Yes! The dashboard is fully customizable. You can add or remove KPIs, modify formulas, or change visuals to fit your store’s needs.
4. Is this dashboard suitable for multiple store branches?
Absolutely. You can create separate sheets for each branch or merge data into one consolidated dashboard.
5. Do I need technical skills to use this dashboard?
Not at all. The template is beginner-friendly. Basic knowledge of Google Sheets formulas is enough to get started.
6. How does the dashboard handle year-over-year comparisons?
It includes a Previous Year Numbers sheet that automatically compares current year data with last year’s results.
7. Can this dashboard be shared with my staff?
Yes. Google Sheets allows multiple users to collaborate in real-time, ensuring everyone stays aligned on performance goals.
Visit our YouTube channel to learn step-by-step video tutorials
Watch the step-by-step video tutorial:
Click to buy Convenience Store KPI Dashboard in Google Sheets